- GBP/USD takes U-turn from two-month-old falling trend-line.
- 1.2200/2195 becomes nearby support-confluence to watch.
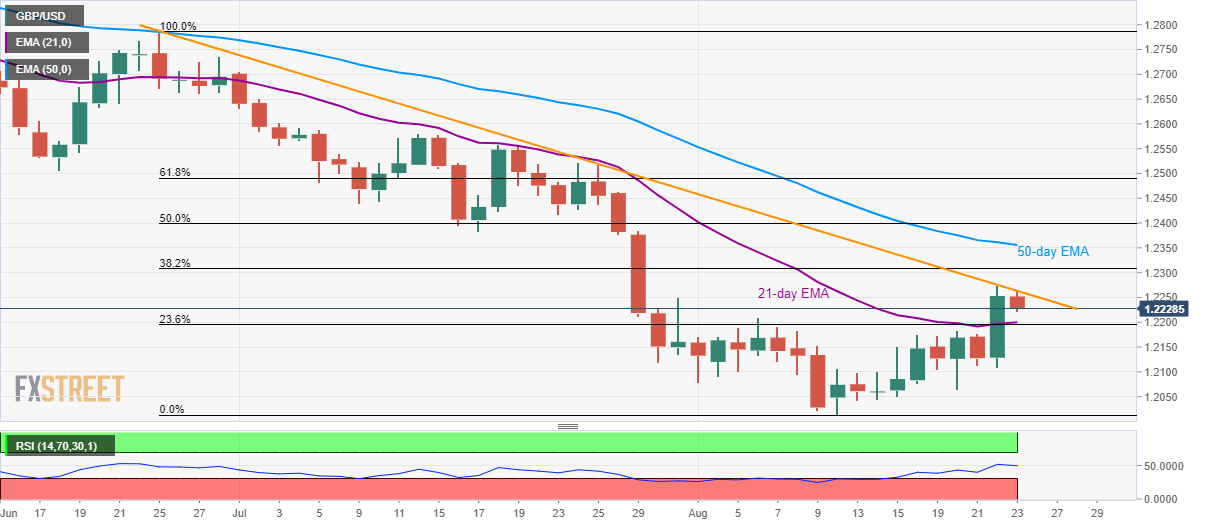
- 50-day EMA, 1.2385 can please buyers during the fresh rise.
GBP/USD fails to hold its earlier run-up to three-week high and is presently declining to 1.2230 while heading into the London open on Friday.
The 21-day exponential moving average (EMA) and 23.6% Fibonacci retracement of June-August downside, near 1.2200/2195, grabs immediate attention of sellers as it holds the key to the quote’s slump to 1.2100.
If at all sellers refrain from stepping back around 1.2100, 1.2050 and monthly low near 1.2015 could become their favorites.
It should also be noted that the year 2017 bottom of 1.1987 and 2016 trough of 1.1806 could come back to charts if bears dominate past-1.2015.
GBP/USD daily chart
Trend: Bearish
