- GBP/USD slips below 23.6% Fibonacci retracement of September-December upside.
- A downside break of 21-day SMA will drag prices to the 12-week-old rising support line.
- Weekly highs cap immediate upside.
GBP/USD remains modestly changed to 1.3140 amid the Asian session on Friday. The quote slipped below 23.6% Fibonacci retracement of its last three-month rise during the latest declines. Even so, 21-day SMA, at 1.3122 now, restricts the pair’s nearby downside.
While prices keep being soft below 23.6% Fibonacci retracement, a daily closing under 1.3120 becomes necessary for the Bears to dominate. In doing so, an upward sloping trend line since October 10 around 1.3000 will be on the sellers’ radars.
If at all the weakness persists below 1.3000, December low near 1.2900 and late-November bottom around 1.2820 could return to the charts.
On the contrary, the weekly high surrounding 1.3285 and December 16 low around 1.3320 could lure buyers during fresh recovery.
However, the major upside can’t be expected unless clearing the previous year’s top of 1.3515.
GBP/USD daily chart
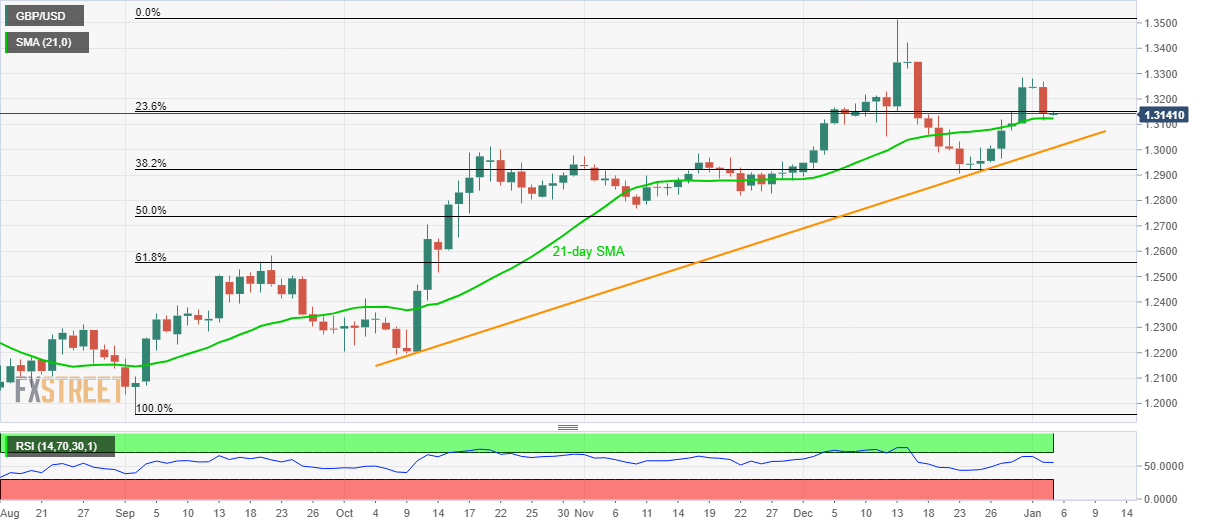
Trend: Pullback expected
