- GBP/USD rises to 2-day high while struggling around 23.6% Fibonacci retracement of July-August declines.
- 4H 100MA and one-wee-old falling trend-line limit pair’s immediate upside while 1.2000 acts as the key downside support.
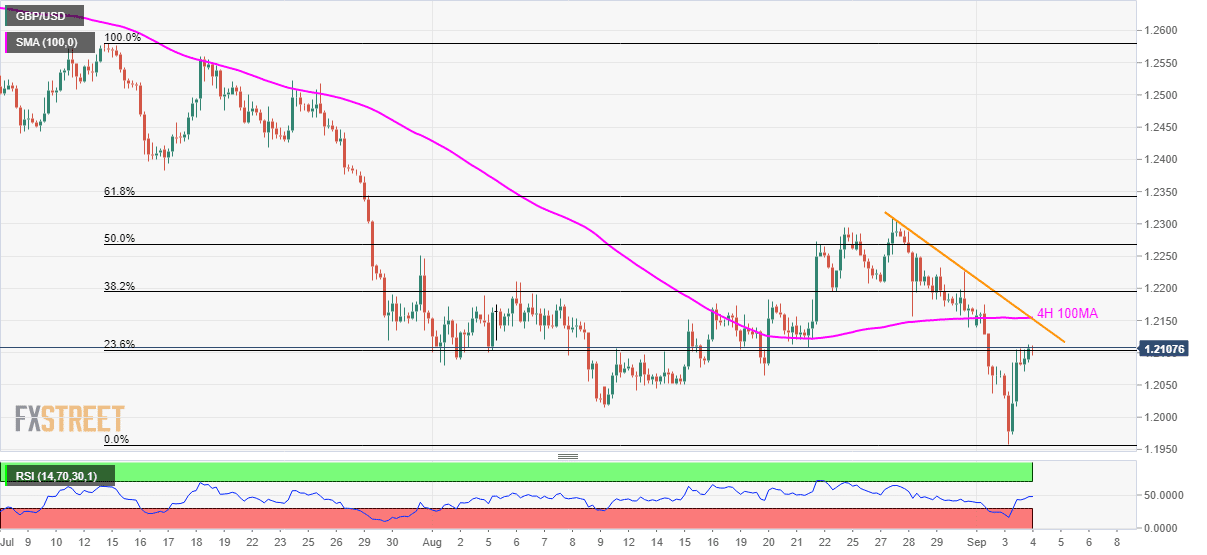
Following its gradual recovery since late-Tuesday, GBP/USD inches up to 23.6% Fibonacci retracement while taking the bids to 1.2105 heading into the UK open on Wednesday.
The Cable now aims to confront 1.2150/55 resistance-confluence including 100-bar simple moving average on the four-hour chart (4H 100MA) and a falling trend-line since August 27.
Should the pair manage to clear the key upside barrier, it can rise to late-August tops near 1.2310.
On the contrary, failure to sustain the latest recovery can drag the pair back to 1.2000 round-figure that has witnessed fewer breaks since 1985.
GBP/USD 4-hour chart
Trend: pullback expected
