- GBP/USD pauses five-day-old downside.
- 23.6% of Fibonacci retracement acts as immediate resistance.
- 200-day EMA, 50% Fibonacci retracement add to the supports.
GBP/USD seesaws around 1.2940 amid Tuesday’s Asian session. In doing so, the pair bounces off 50-day Exponential Moving Average (EMA) and 38.2% Fibonacci retracement of September-December upside.
Considering the strength of support and weakness in the 12-bar Relative Strength Index (RSI), prices are likely to recover to 23.6% Fibonacci retracement level of 1.3150. However, 1.3000 round-figure will offer immediate resistance to the pair.
Should there be further upside beyond 1.3150, 1.3230 and December 16 low near 1.3320 will be in the spotlight.
On the contrary, a downside break of 1.2925/20 support confluence will highlight a 200-day EMA level of 1.2768 prior to diverting the Bears towards 50% Fibonacci retracement, near 1.2735.
If at all sellers dominate beneath 1.2735, September month high near 1.2580 will return to the charts.
GBP/USD daily chart
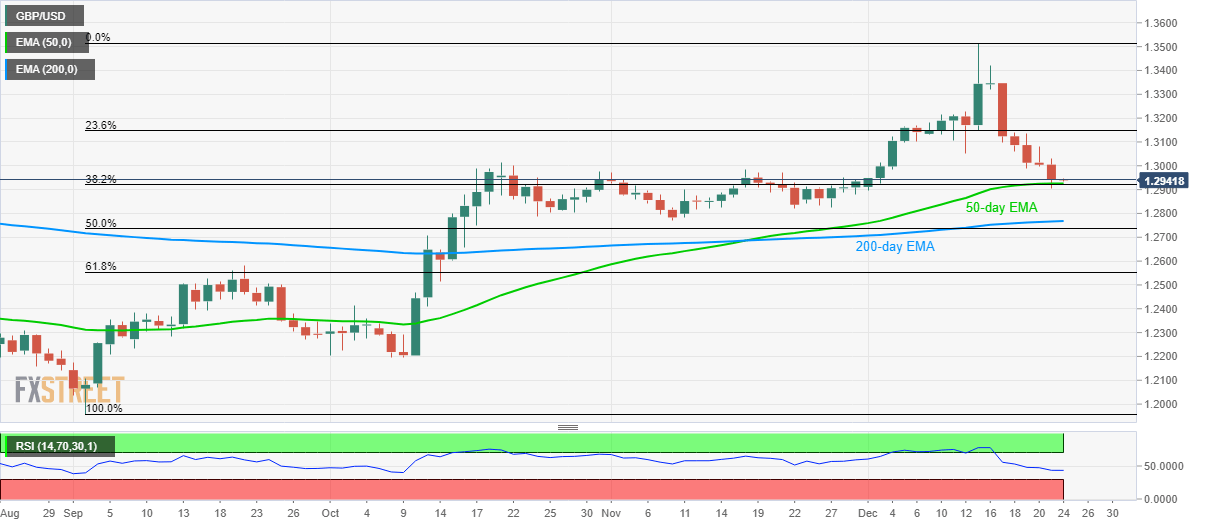
Trend: Pullback expected
