- GBP/USD seesaws around 38.2% Fibonacci retracement of June-September decline.
- 50-day EMA, a rising trend-line since July 31 limit pair’s nearby advances.
- Early August high, 21-DMA become adjacent supports to watch.
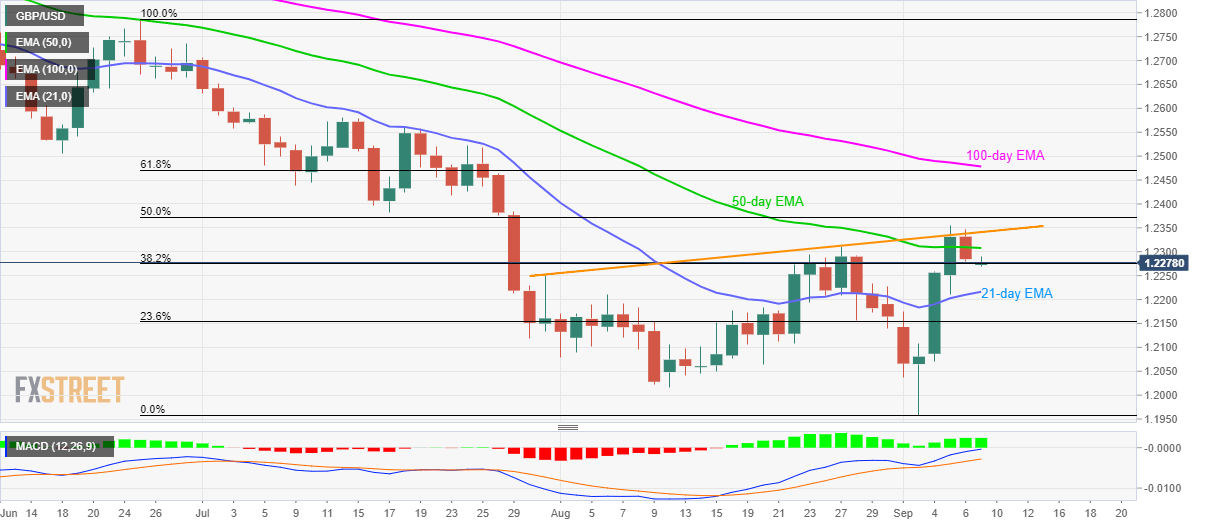
Despite pulling back from more than a month old rising trend-line, also falling below 50-day EMA, GBP/USD takes the rounds to 38.2% Fibonacci retracement as it trades near 1.2285 during early Monday.
With the 12-bar moving average convergence and divergence (MACD) indicating bullish signals, the pair can again confront 50-day exponential moving average (EMA) level of 1.2310 ahead of challenging a rising trend-line since July 31, at 1.2340 now.
If at all prices manage to clear 1.2340 on a daily closing basis, 50% Fibonacci retracement level of 1.2372 could act as an intermediate halt before fueling prices to 1.2470/80 area including 61.8% Fibonacci retracement and 100-day EMA.
Alternatively, 21-day EMA level of 1.2217, near to August 06 high of 1.2210, acts as adjacent support-zone for the pair traders to watch during the pullback below 38.2% Fibonacci retracement.
Should there be additional downside past-1.2210, September 03 high near 1.2100 will gain bears’ attention.
GBP/USD daily chart
Trend: bullish
