- GBP/USD seesaws around the intra-day low.
- Near-term key supports could restrict the pair’s declines as RSI stays in normal conditions.
- An upside break of the triangle could challenge the weekly high.
GBP/USD remains on the back foot while dropping to 1.2850 amid Wednesday’s Asian session.
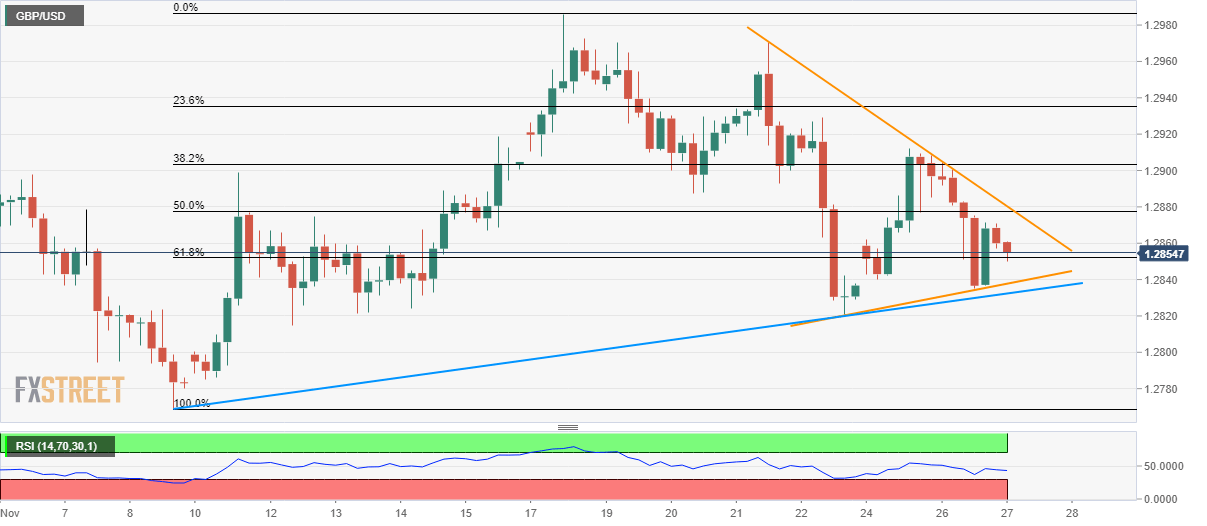
The pair now tests 61.8% Fibonacci retracement level of the current month upside, a break of which could drag the quote to the three-day-old rising support line, forming part of immediate triangle, at 1.2837. Additionally, an upward sloping trend line since November 08, at 1.2832, can limit pair’s further declines.
While normal conditions of 14-bar Relative Strength Index (RSI) portrays brighter chances of pair’s U-turn from 1.2832, failure to do so can please sellers with 1.2820 and sub-1.2800 mark.
Alternatively, pair’s rise above the triangle’s resistance line, at 1.2880, which also nears 50% Fibonacci retracement, can trigger fresh rise towards the weekly top surrounding 1.2915.
Though, 23.6% Fibonacci retracement level of 1.2935 and November 21 high around 1.2970 can keep buyers in check afterward.
GBP/USD 4-hour chart
Trend: Pullback expected
