- The cable is starting the week with a mild recovery aiming at the 1.2900 handle.
- The level to beat for bulls is the 1.2900/1.2916 resistance zone.
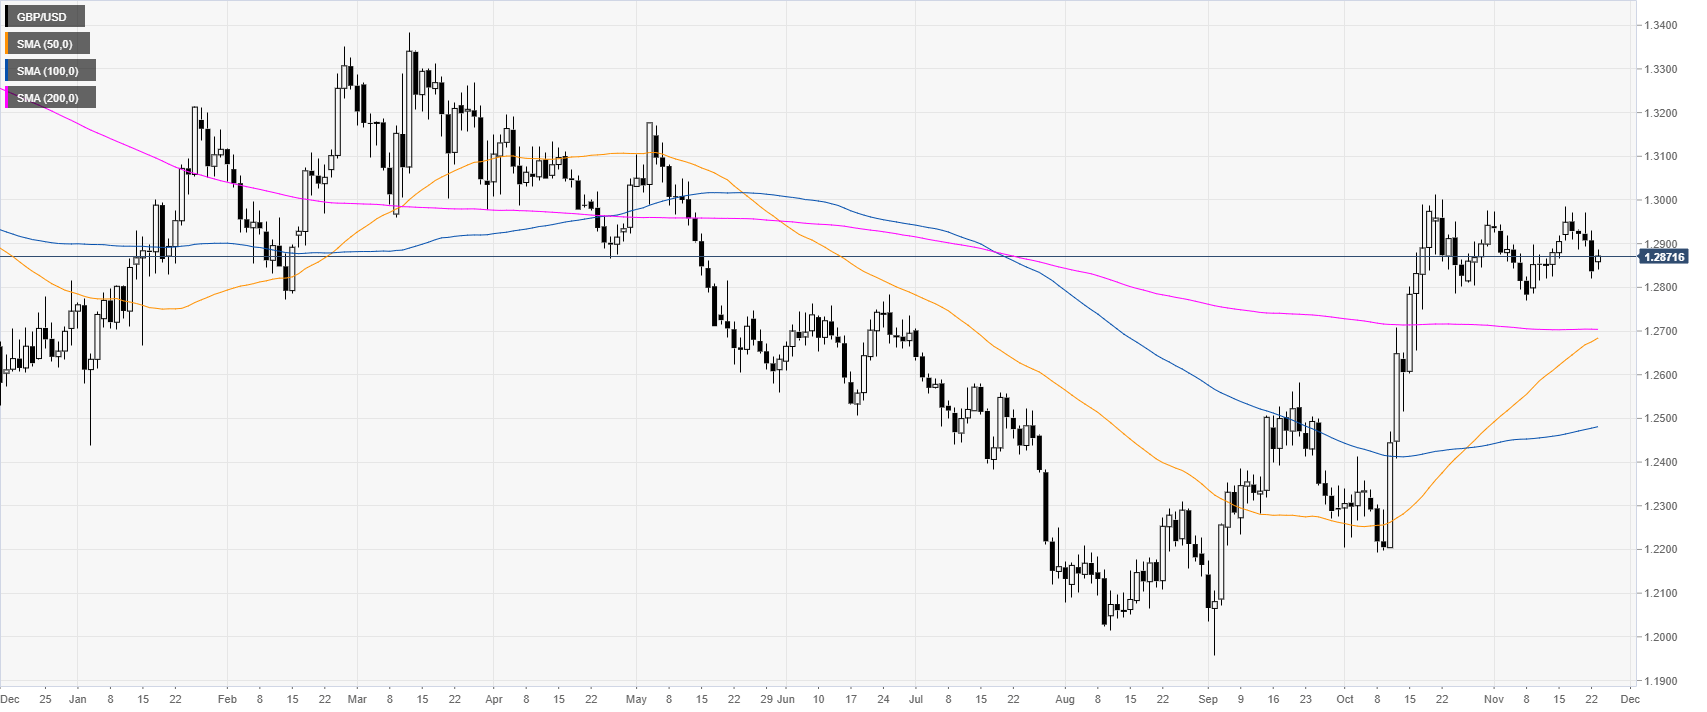
GBP/USD daily chart
GBP/USD is trading below the 1.2900 handle as the market is chopping in November. The spot keeps an underlying bullish bias while above its main daily simple moving averages (DMAs).
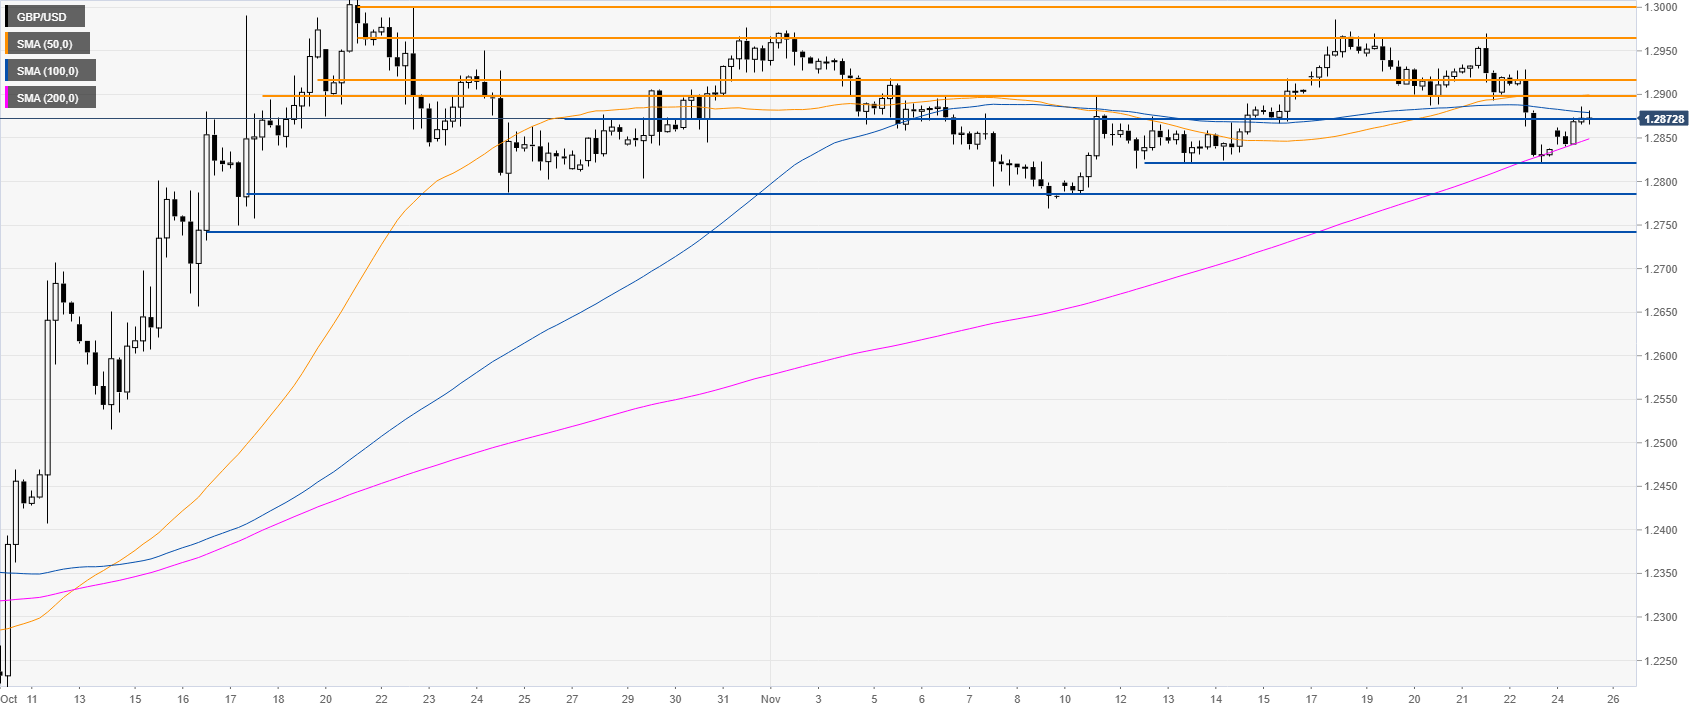
GBP/USD four-hour chart
The market is trading above a rising 200 SMA, suggesting bullish momentum. A break above the 1.2900/1.2916 resistance zone can lead to further gains towards the 1.2964/1.3000 resistance zone, according to the Technical Confluences Indicator.
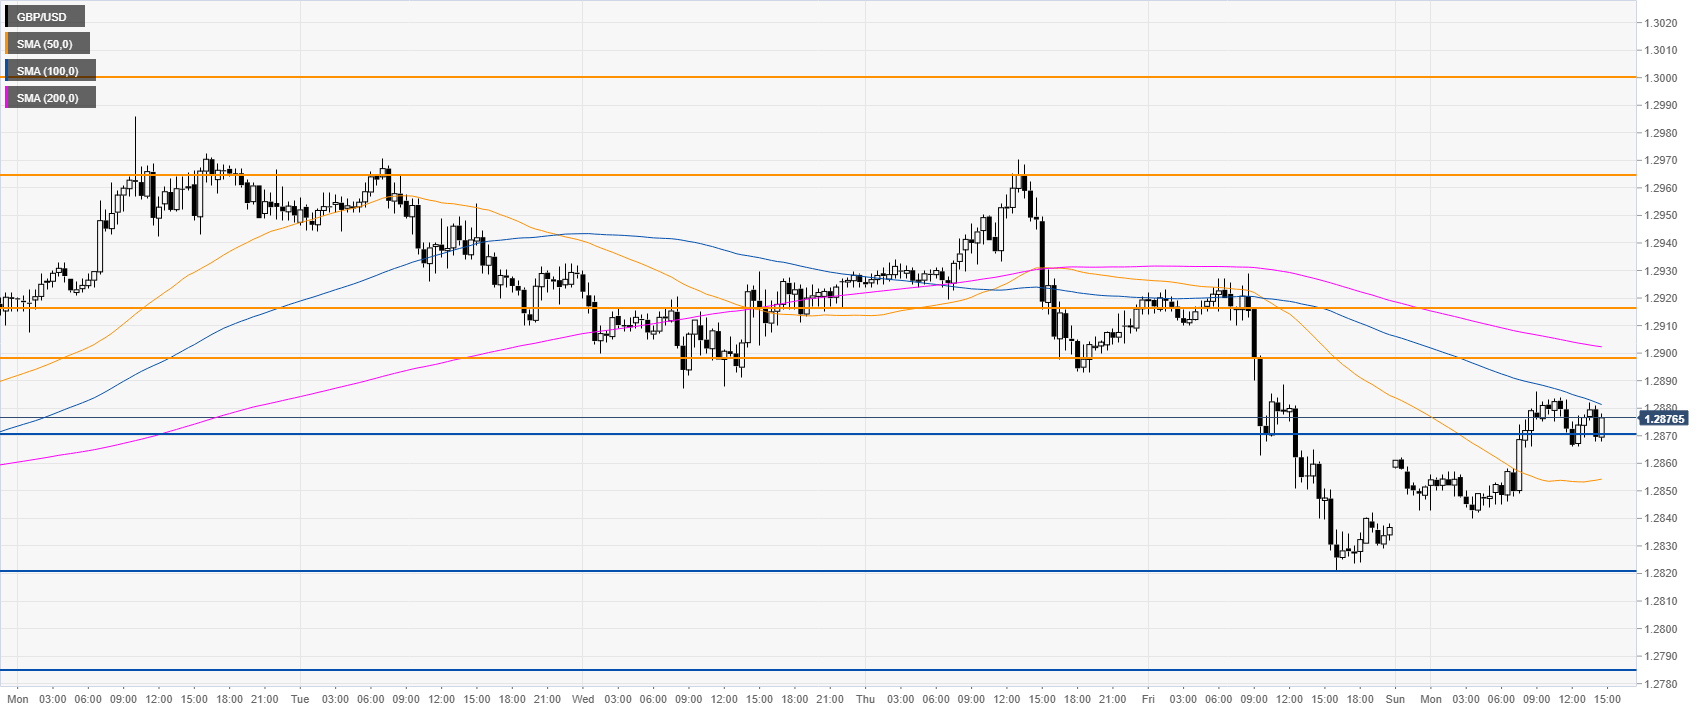
GBP/USD 30-minute chart
GBP/USD is starting the week with an attempt at regaining the 1.2900 handle. So far, this has not happened yet; however, if the bears don’t show up soon, the buyers will likely take control and lift the market above the 1.2900/1.2916 resistance zone.
Support is seen at the 1.2870 and 1.2820 price levels.
Additional key levels
