- GBP/USD turns weaker after rising to a two-month high.
- Immediate rising trend-line questions the sellers targeting 200-bar EMA, 38.2% Fibonacci retracement confluence.
GBP/USD stays on the back foot while taking rounds to 1.2470 ahead of the UK session start on Thursday.
The pair portrays lower-high formation supported by a bearish signal from 12-bar moving average convergence and divergence (MACD) indicator.
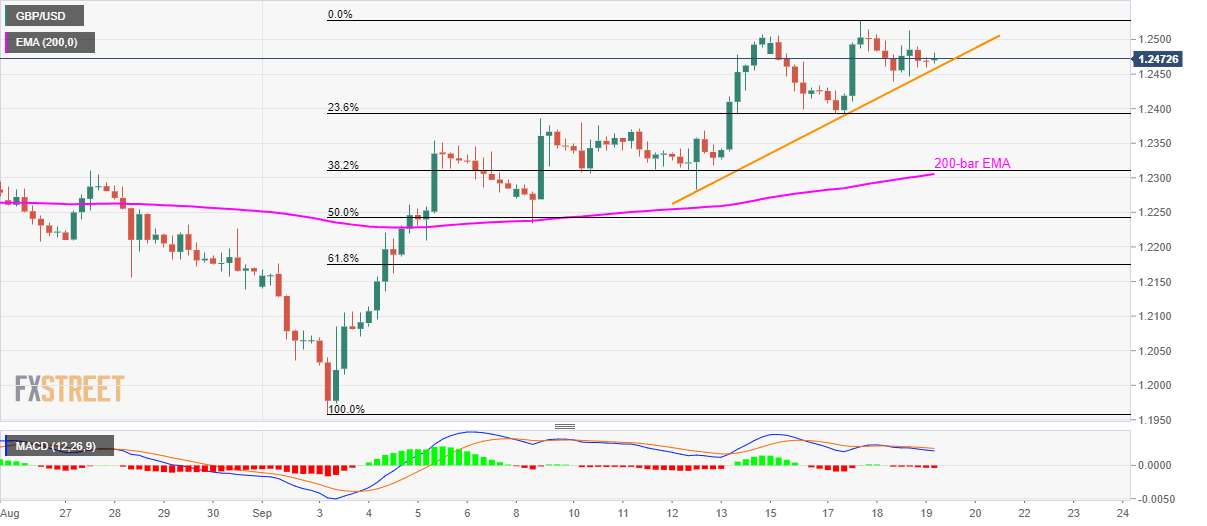
Even so, an upward sloping trend-line since September 12 still holds the downside confined around 1.2455, a break of which could call sellers targeting 1.2310/05 confluence that comprises 200-bar exponential moving average (EMA) and 38.2% Fibonacci retracement level of current month upside.
However, 23.6% Fibonacci retracement level close to 1.2390 and September 05 high near 1.2355 could offer intermediate halts during the south-run.
Alternatively, pair’s rise above latest high around 1.2530 paves the way for a fresh rally towards mid-July peak nearing 1.2580.
GBP/USD 4-hour chart
Trend: pullback expected
