- GBP/USD bounces off a year-old support-line amid oversold RSI.
- Buyers stay away unless clearing mid-July lows.
Following its U-turn from a downward sloping trend-line since August 2018, the GBP/USD pair takes the rounds to 1.2130 heading into the London open on Thursday.
While oversold levels of 14-day relative strength index (RSI) favor the odds of the pair’s pullback towards 1.2250 on the break of 1.2170, July 17 low and 21-day exponential moving average (EMA) can keep the upside limited around 1.2382 and 1.2400 respectively.
Given the pair’s ability to cross 1.2400 on a daily closing basis, buyers can target January month bottom surrounding 1.2440 ahead of aiming 1.2500 and July month top near 1.2580.
Alternatively, pair’s weakness beneath 1.2100 long-term support-line can take rest around 1.2000 psychological magnet whereas 2017 low near 1.1980 could question bears afterward.
GBP/USD daily chart
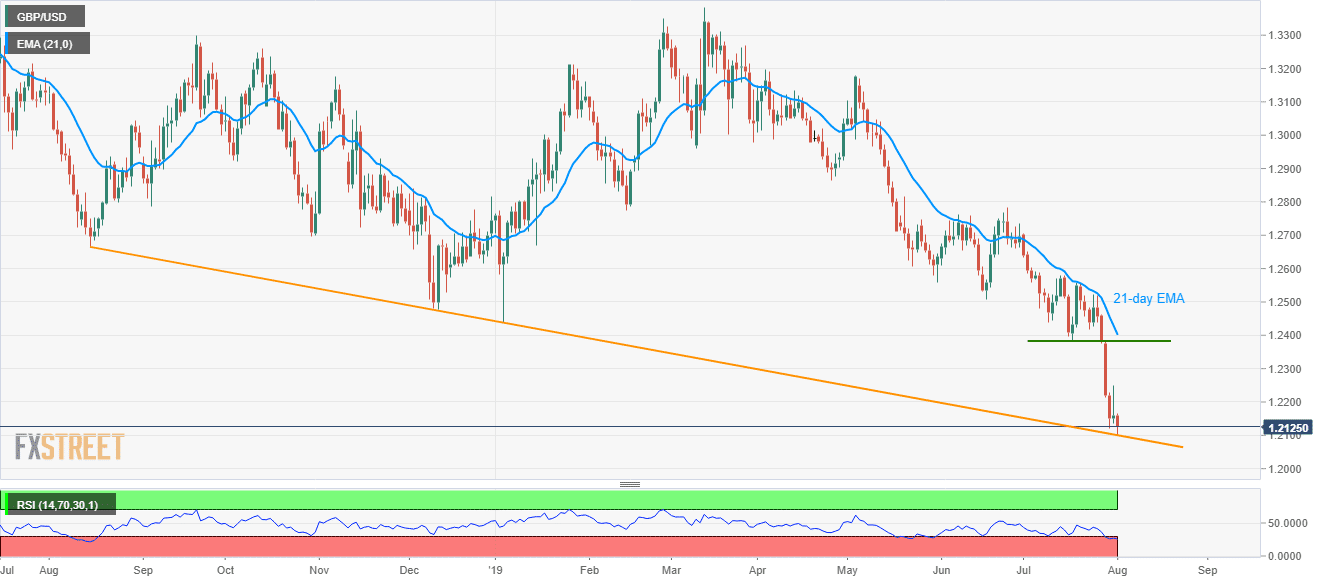
Trend: Bearish
