- As GBP/USD couldn’t break above 1.3200 earlier in Europe, the market decided to test 1.3100.
- GBP/USD extended the daily losses but has not yet reached the 1.3100-1.3076 area, which is comprised by the figure and the current weekly low.
- As GBP/USD dropped about a 100 pips, today’s sell-off is quite discouraging for bulls, however, the market will pay close attention to what will happen at the 1.3100 figure and the current weekly low at 1.3076; the market might create a pullback up of the last leg lower.
GBP/USD 15-minute chart
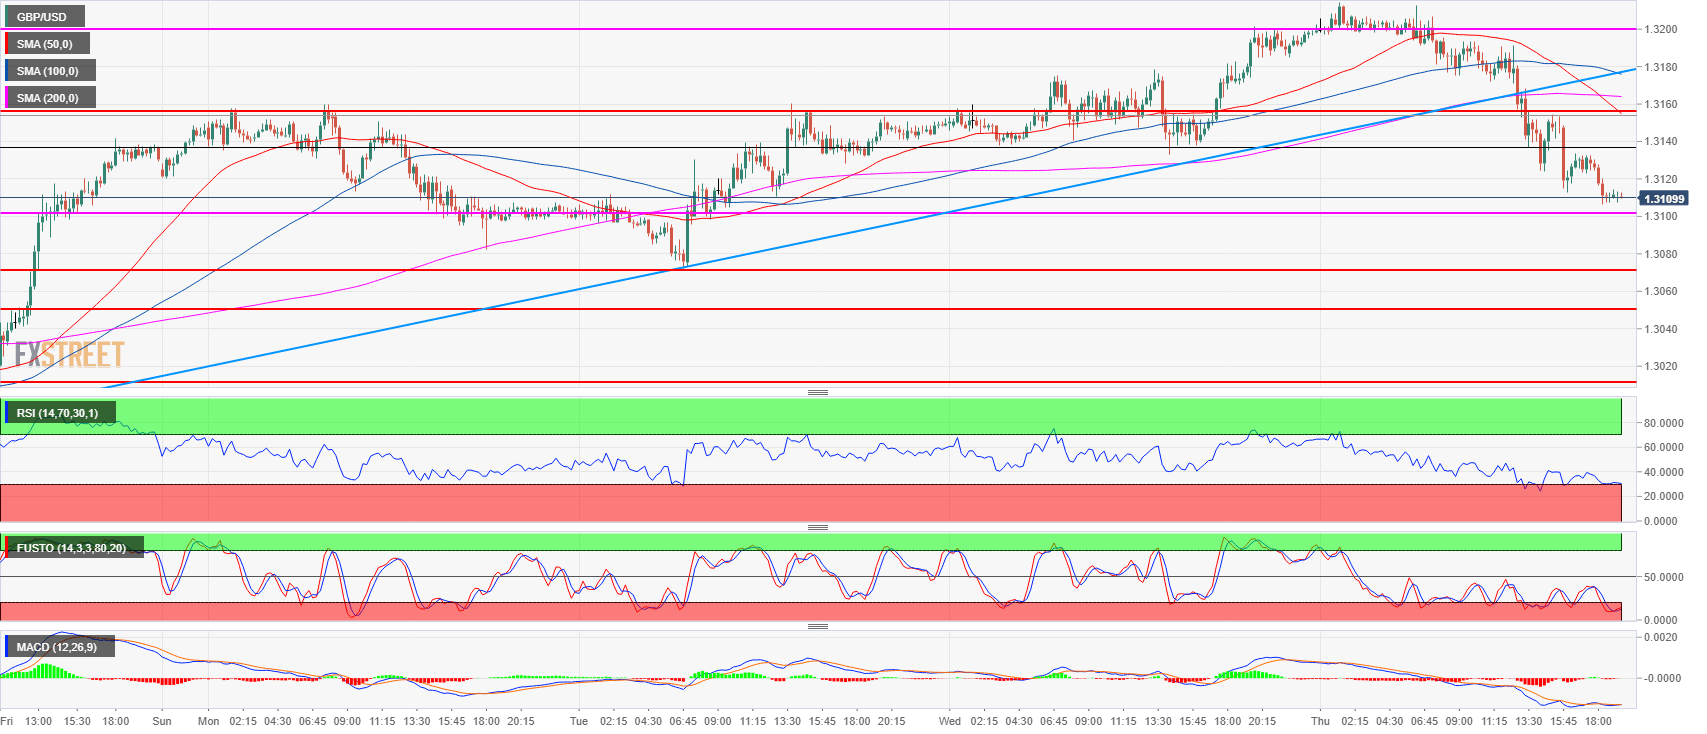
Spot rate: 1.3110
Relative change: -0.60%
High: 1.3214
Low: 1.3106
Trend: Bearish
Resistance 1: 1.3155 former breakout point
Resistance 2: 1.3200 figure
Resistance 3: 1.3230 supply level
Resistance 4: 1.3250 June 4 high
Support 1: 1.3100-1.3076 area, figure and weekly low
Support 2: 1.3049 June 28 low
Support 3: 1.3010 July 18 low
Support 4: 1.2957 current 2018 low
Support 5: 1.2908 September 5, 2017 low
