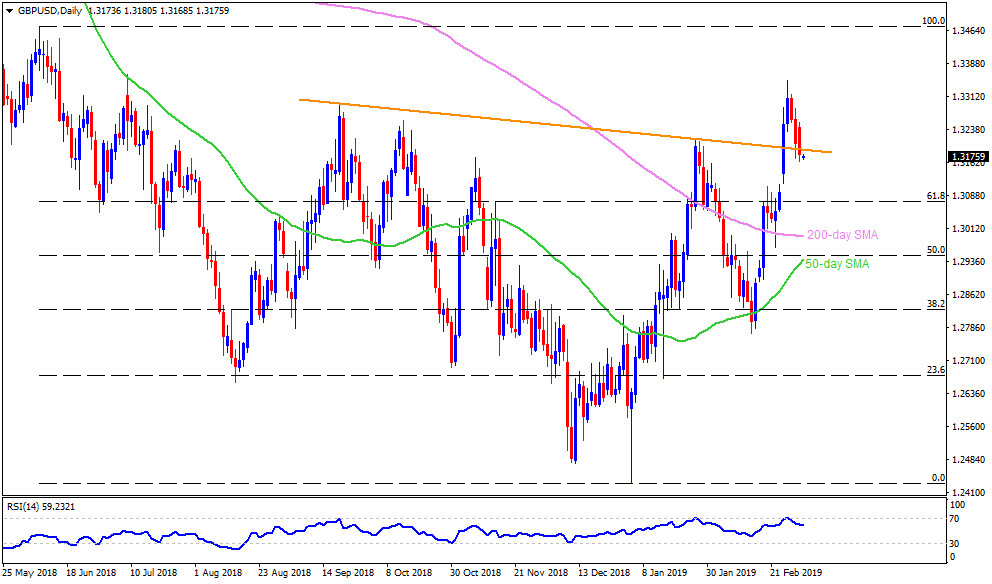
GBP/USD daily chart
- GBP/USD stretches its slid beneath resistance-turned-support by trading near 1.3175 during early Tuesday.
- With the pair’s sustained trading under 1.3190 support-line, now resistance, that joins highs marked in September 2018 and January 2019, 61.8% Fibonacci retracement of its June 2018 to January 2019 drop near 1.3070 can’t be denied.
- However, 1.3000-1.2990 support-zone, including 200-day simple moving average (SMA), could restrict the pair’s south-run under 1.3070.
- Meanwhile, pair’s pullback may have to surpass 1.3190 on a daily closing to challenge 1.3260 and the February month high around 1.3350.
- During the pair’s successful trading beyond 1.3350, 1.3385 and 1.3445 may act as buffers ahead of highlighting 1.3475 resistance.
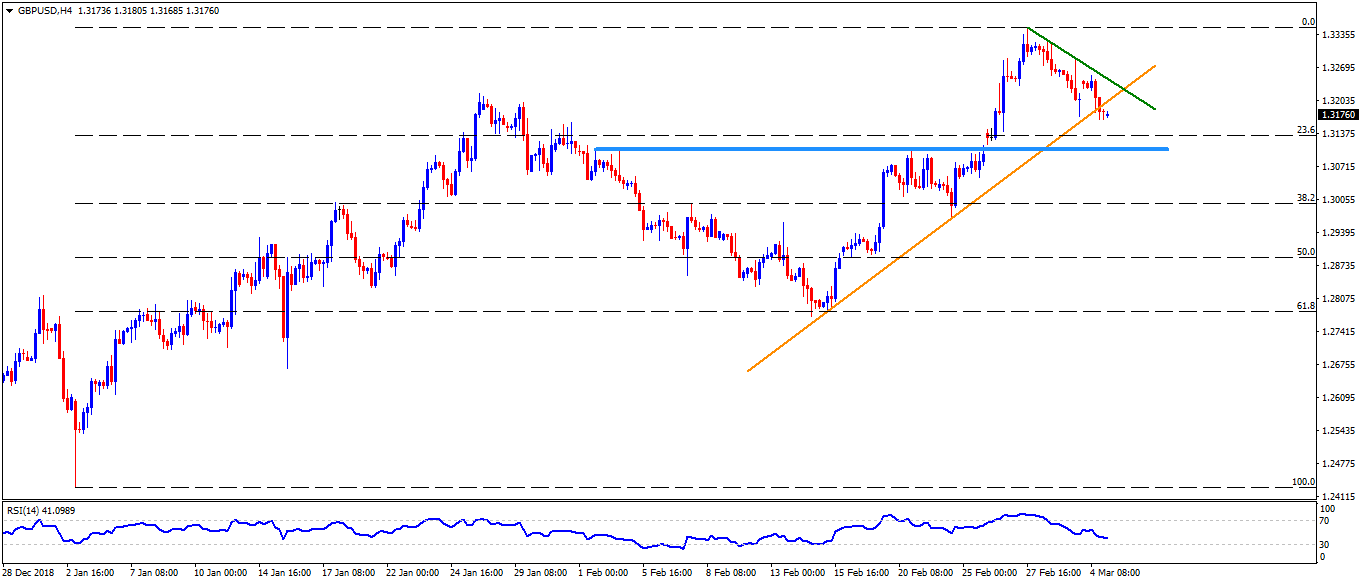
GBP/USD 4-Hour chart
- Break of an upward sloping support-line connecting lows since February 15 validates the pair’s recent weakness towards 1.3100 horizontal-support.
- Descending trend-line joining recent highs can offer immediate resistance to the pair near 1.3245 ahead of fuelling it to the recent high near 1.3350.
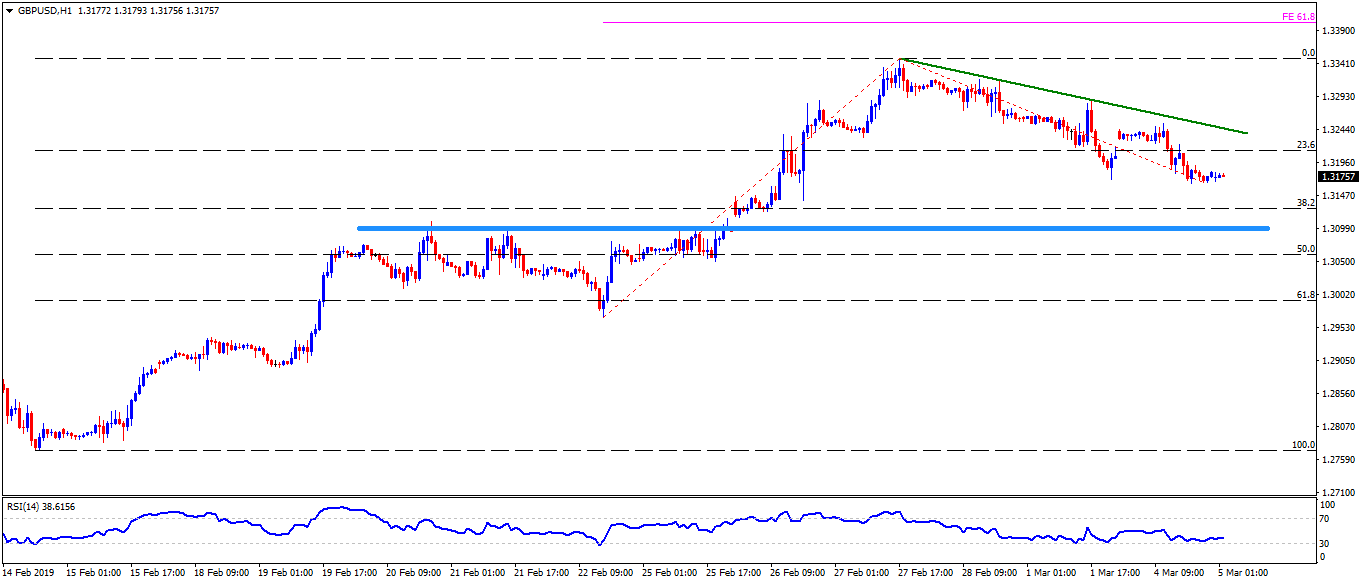
GBP/USD hourly chart
- 61.8% Fibonacci expansion at 1.3400 can offer an intermediate halt during the pair’s rise from 1.3385 toward 1.3445.
- Also, 1.2965, 1.2930 and 1.2900 may entertain sellers past-1.2990 break.