“¢ The pair finally broke below the 1.3100 handle, marking the neckline support of a bearish head & shoulders chart pattern on the 4-hourly chart.
“¢ Technical indicators on the mentioned chart have started gaining negative momentum and add credence to the bearish breakdown.
“¢ Even the slightest of disappointment from today’s UK construction PMI might accelerate the downfall, albeit might be limited ahead of the BoE Super Thursday.
GBP/USD 4-hourly chart
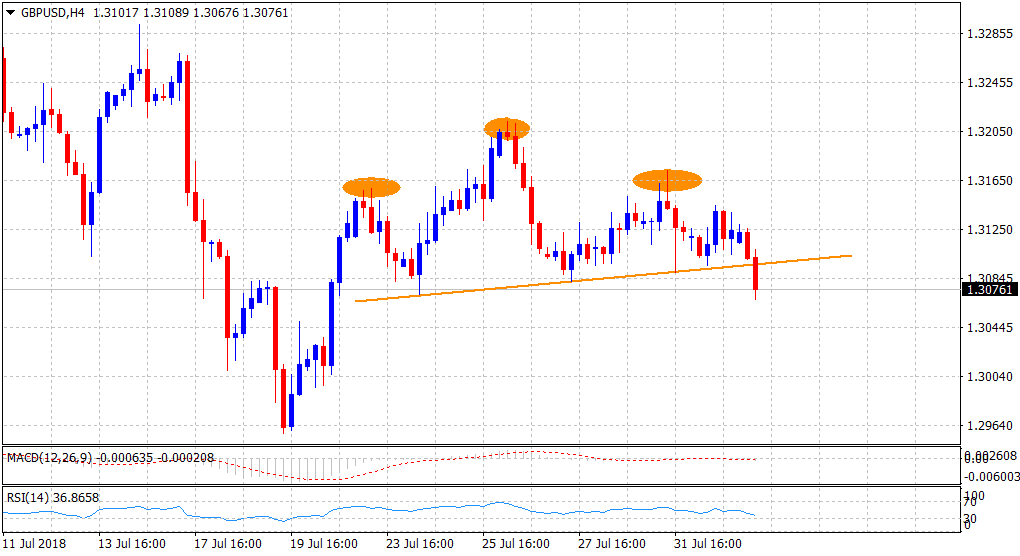
Spot rate: 1.3076
Daily High: 1.3129
Trend: Bearish
Resistance
R1: 1.3096 (trend-line support break-point)
R2: 1.3129 (current day swing high)
R3: 1.3150 (R1 daily pivot-point)
Support
S1: 1.3049 (S3 daily pivot-point)
S2: 1.3015 (horizontal zone)
S3: 1.2957 (YTD low set on July 19)
