- GBP/USD carries the latest recovery towards near-term key resistance-line amid bullish MACD.
- 21-DMA can question buyers if the trend-line breaks, 1.2015 becomes the key support.
GBP/USD recovers to 1.2100 as bullish MACD pleases buyers while heading into the UK session open on Friday.
Traders now look forward to a downward sloping trend-line since month-start, at 1.2140 as the key resistance ahead of targeting 21-day moving average (21-DMA) level of 1.2217.
In a case prices move beyond 1.2217, 38.2% Fibonacci retracement of June-August declines, at 1.2310 and July 17 low near 1.2382 could mark come back on the chart.
Meanwhile, pair’s decline below the latest low of 1.2015, irrespective of bullish signal from 12-bar moving average convergence and divergence (MACD), opens the door for the fresh plunge to 2017 low of 1.1987 and then towards 2016 bottom surrounding 1.1806.
GBP/USD daily chart
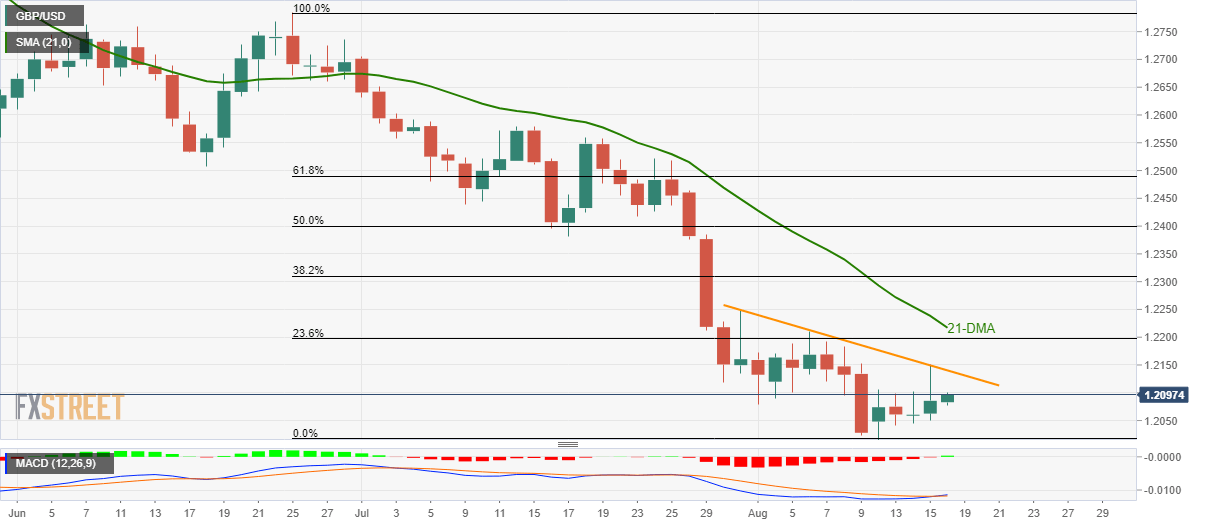
Trend: Recovery expected
