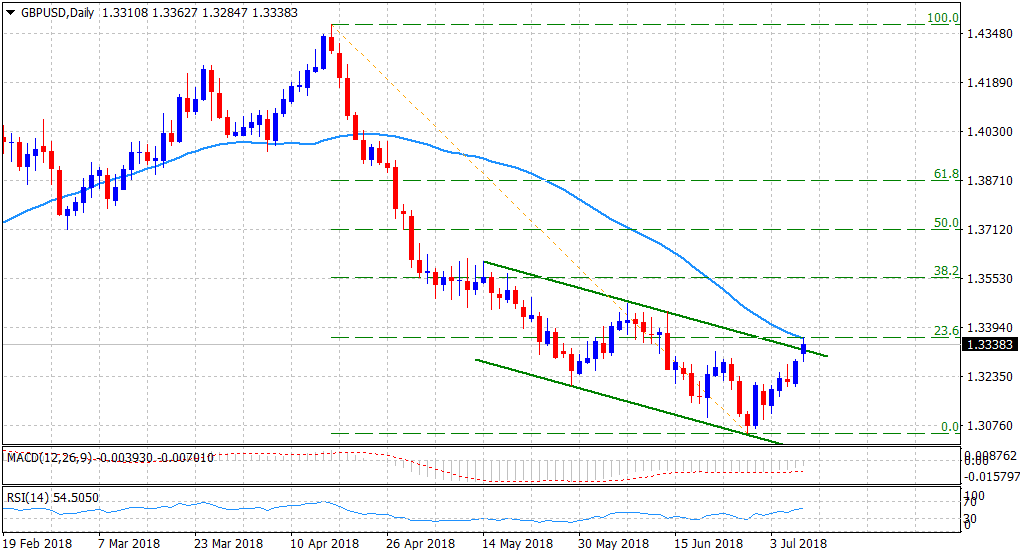
“¢ Reverses an Asian session dip to sub-1.3300 level and finally breaks through a short-term descending trend-channel formation on the daily chart.
“¢ The positive momentum stalled, at least for the time being, near an important confluence region, comprising of 50-day SMA and 23.6% Fibonacci retracement level of the 1.4377-1.3050 downfall.
“¢ With short-term technical indicators gradually picking up positive momentum, a follow-through buying beyond the mentioned barrier would reaffirm the bullish break and pave the way for an extension of the pair’s near-term upward trajectory.
Spot Rate: 1.3338
Daily High: 1.3363
Daily Low: 1.3285
Trend: Bullish
Resistance
R1: 1.3358 (confluence region)
R2: 1.3405 (R3 daily pivot-point)
R3: 1.3447 (June 14 swing high)
Support
S1: 1.3285 (current day swing low)
S2: 1.3232 (100-period SMA H1)
S3: 1.3200 (round figure mark)
