- GBP/USD holds firm above 23.6% Fibonacci retracement after breaking short-term resistance-line.
- A six-day-old ascending trend-line appears as immediate resistance.
Following its break of 13-day old descending trend-line, GBP/USD successfully trades above 23.6% Fibonacci retracement of its mid-July to early-August declines while flashing 1.2160 as a quote ahead of the UK open on Monday.
As a result, buyers may again target short-term rising trend-line, at 1.2190, during further upside. However, 38.2% Fibonacci retracement level of 1.2230 will become a tough challenge for them considering near overbought conditions of 14-bar relative strength index (RSI).
It worth noting that pair’s rise beyond 1.2230 opens its fresh leg up towards 50% and 61.8% Fibonacci retracement levels around 1.2300 and 1.2365 respectively.
In a case prices slip below 23.6% Fibonacci retracement level of 1.2145, the resistance-turned-support at 1.2115 regains traders’ attention as a break of which can pull the pair back to 1.2080, 1.2050 and 1.2015 support levels.
GBP/USD 4-hour chart
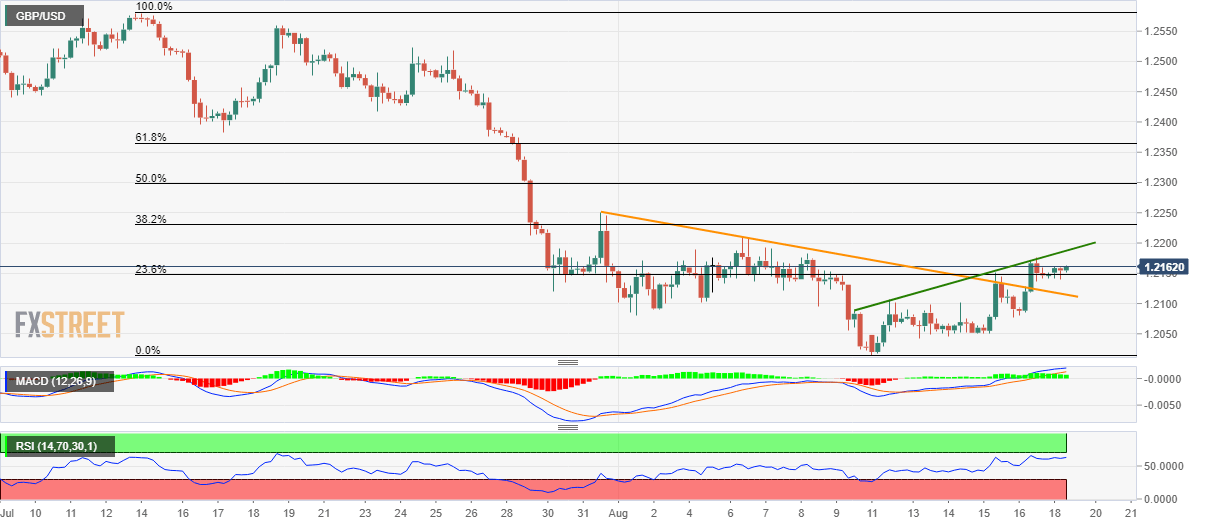
Trend: Pullback expected
