- Repeated failures to cross short-term trend-line resistance, overbought RSI indicates brighter chances for the GBP/USD pair’s pullback.
- 1.2480/77 and 1.2440 become the key supports while 200-HMA seems additional upside barrier.
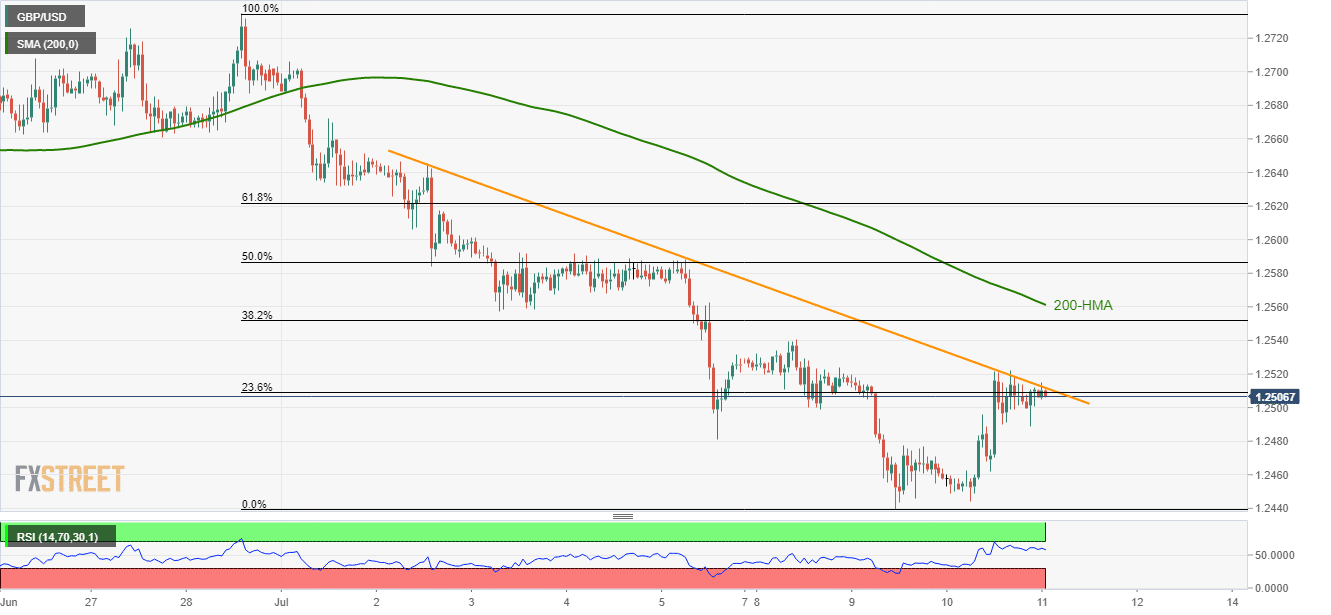
Even if the Federal Reserve Chairman’s Testimony triggered the GBP/USD pair’s upside, the quote still struggles to clear the 9-day long descending trend-line as it trades near 1.2510 during early Thursday.
Not only the short-term resistance-line at 1.2513 but 200-hour moving average (HMA) at 1.2561 also act as a strong upside barrier, a break of which can further propel prices toward 50% Fibonacci retracement of 1.2587.
Other than the repeated failures to clear the aforementioned trend-line, overbought levels of 14-bar relative strength index (RSI) also favors the odds for the quotes pullback.
In doing so, 1.2480/77 support-zone including July 5 low and July 9 high may question sellers ahead of pleasing them with the month’s bottom near 1.2440.
During pair’s additional declines below 1.2440, current year low near 1.2430 can validate further south-run towards 1.2400 round-figure.
GBP/USD hourly chart
Trend: Bearish
