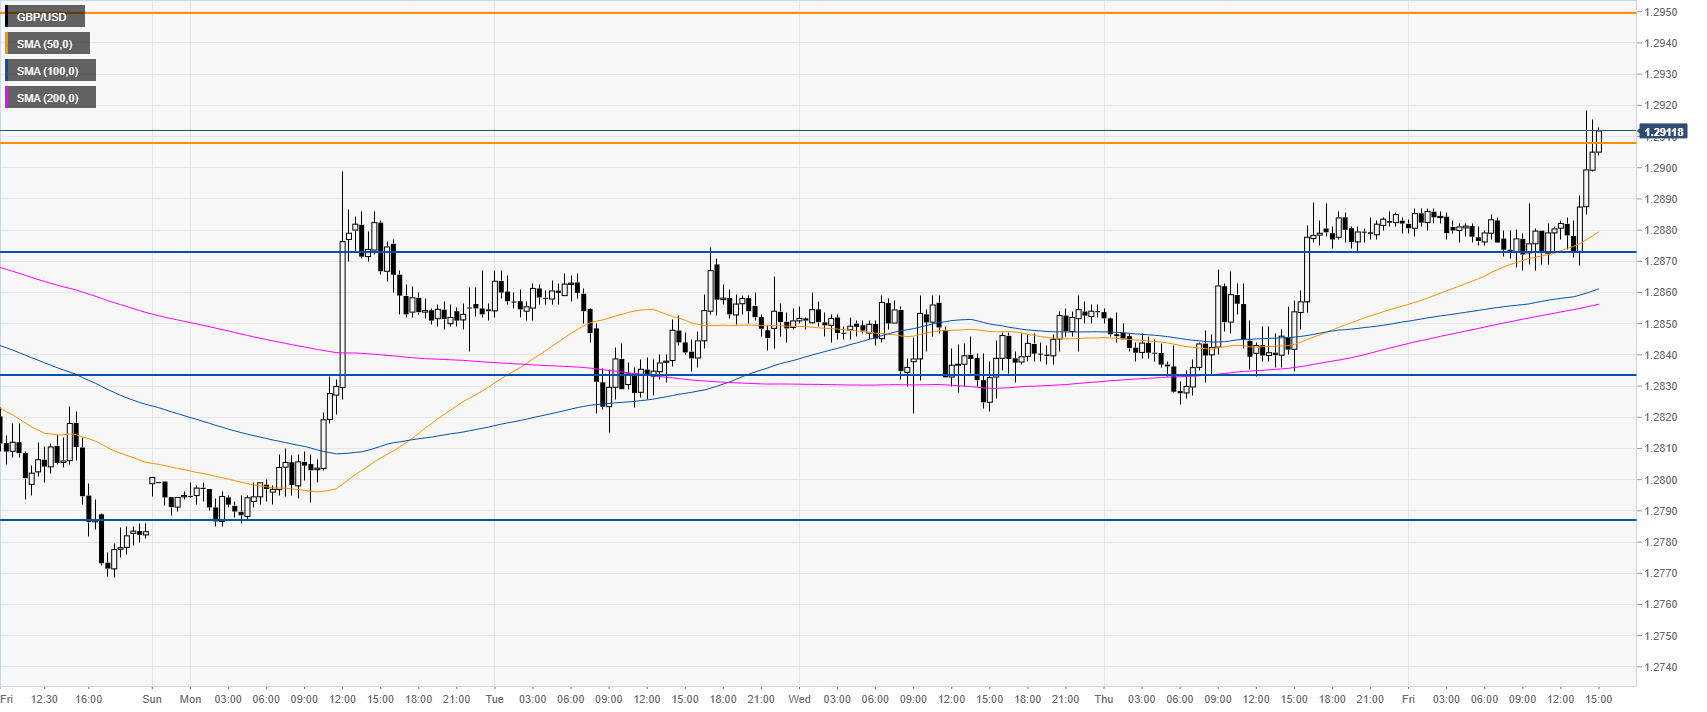
- GBP/USD is ending the week near the weekly highs.
- Resistances to the upside are seen at the 1.2950 level and the 1.3000 handle.
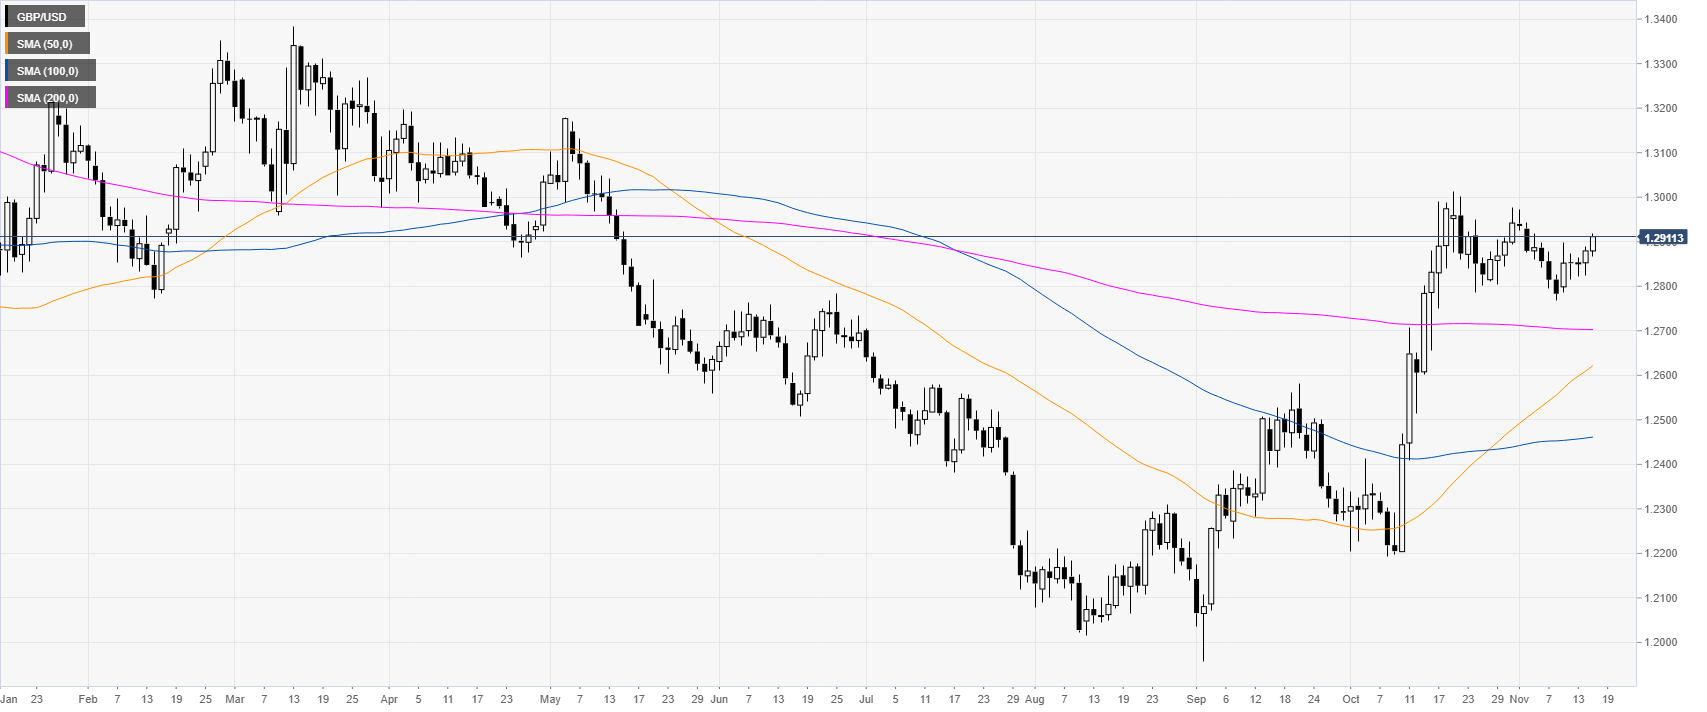
GBP/USD daily chart
The sterling is currently correcting last month’s rally in the 1.2800-1.3000 price zone. GBP/USD, in October, hit levels not seen since mid-May 2019.
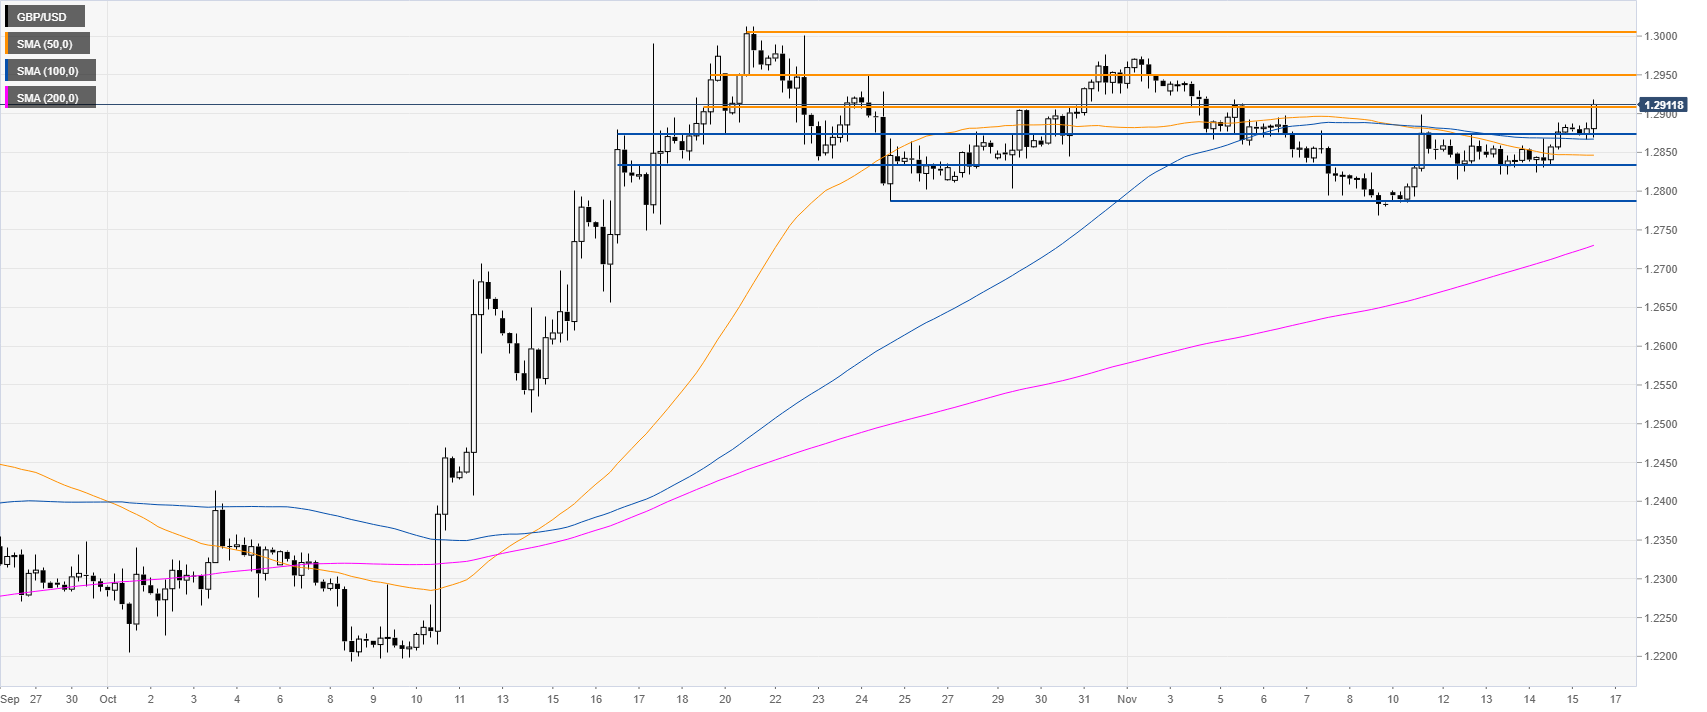
GBP/USD four-hour chart
GBP/USD is breaking above the 1.2874/1.2910 resistance zone. The spot is trading above its main SMAs, suggesting bullish momentum in the medium term. If the market breaks the 1.2910 resistance on a daily basis, the spot could reach the 1.2950 level and the 1.3000 handle on the way up, according to the Technical Confluences Indicator.
GBP/USD 30-minute chart
The spot is trading above its main SMAs, suggesting a bullish bias in the short term. Support is seen at the 1.2874 and the 1.2833 price levels.
Additional key levels
