- GBP/USD bounces off 200-HMA towards 23.6% Fibonacci retracement.
- One-week old rising trend-line adds to the support.
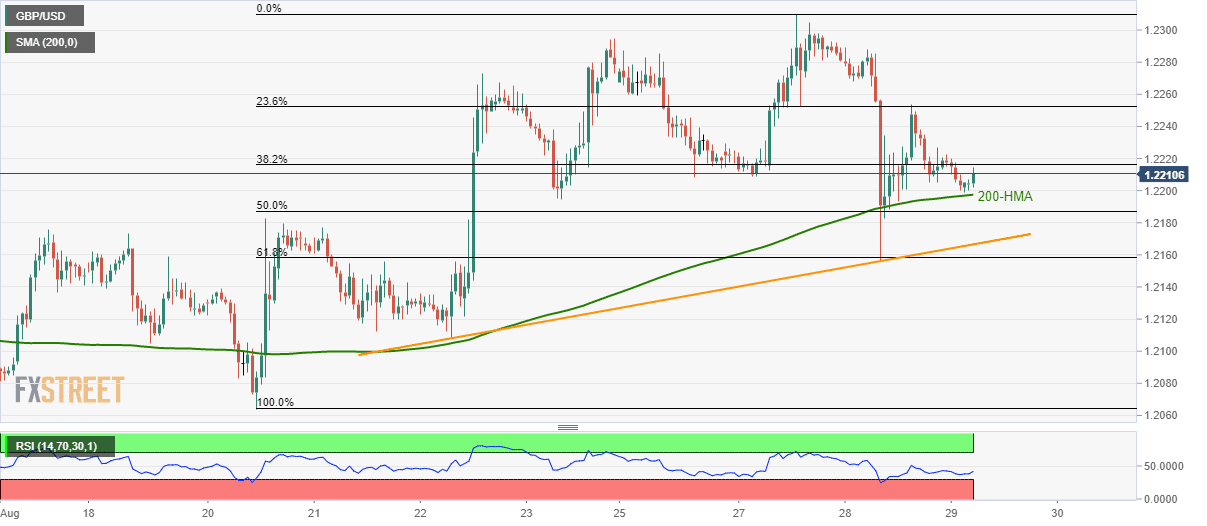
GBP/USD takes another U-turn from 200-hour simple moving average (HMA) while taking rounds to 1.2212 ahead of Thursday’s UK markets’ open.
The pair now eyes, 23.6% Fibonacci retracement of August 20-27 advances, at 1.2252, a break of which could escalate the run-up towards the monthly high of 1.2310.
If prices manage to rise past-1.2310, 50-day simple moving average (50-DMA) level near 1.2360 will flash on the GBP/USD buyers’ radar.
Meanwhile, pair’s decline below 200-HMA level of 1.2198 will be challenged by a week-long upward sloping trend-line at 1.2167 and 61.8% Fibonacci retracement level of 1.2158.
Should there be increased selling pressure below 1.2158, August 20 low near 1.2065 can please the bears.
GBP/USD hourly chart
Trend: pullback expected
