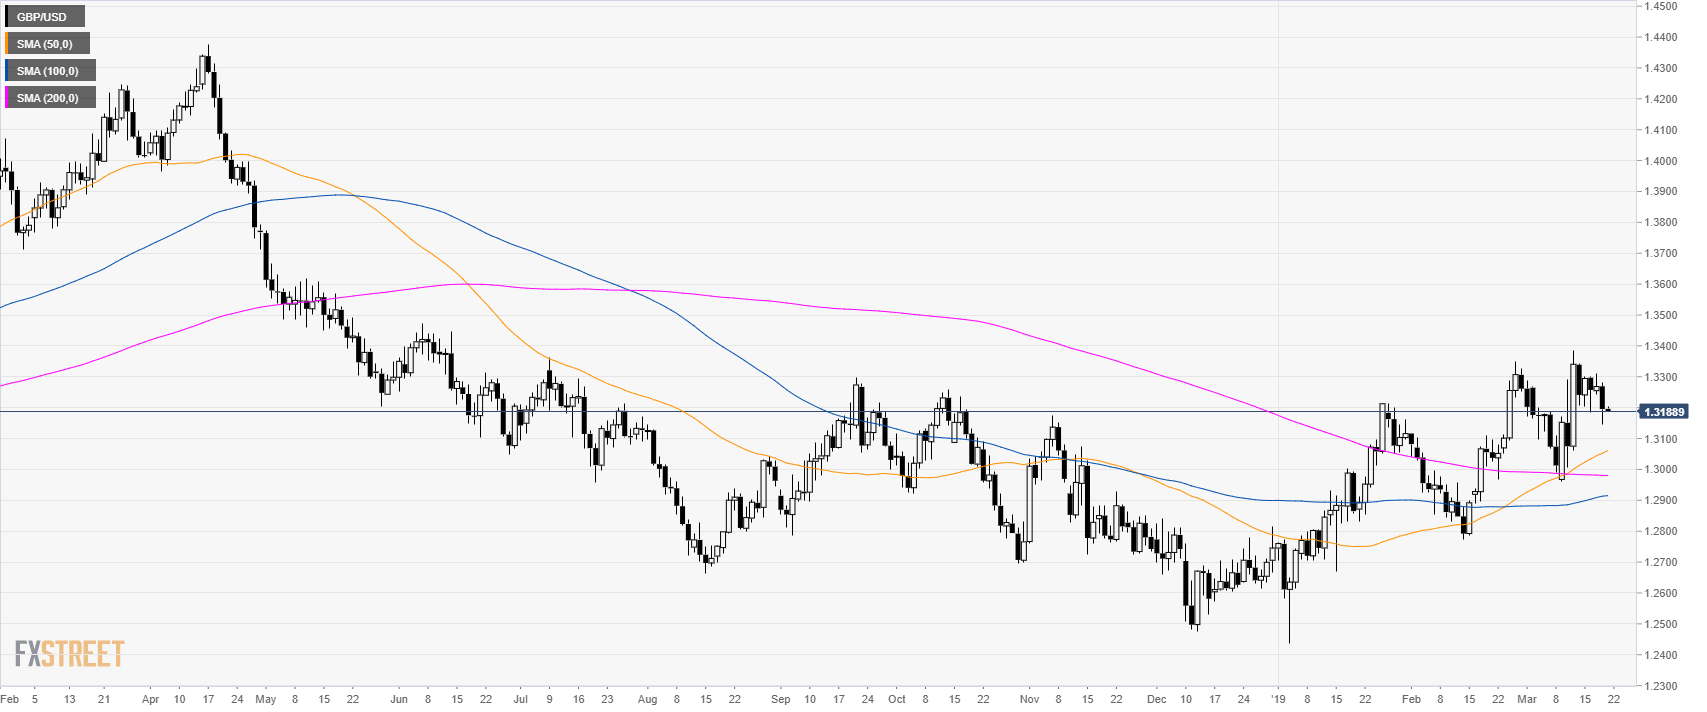
GBP/USD daily chart
- GBP/USD is trading in a bull trend above its main simple moving averages (SMAs).
- Key comments from Theresa May statement following EU’s ultimatum – UK will not leave on the 29th March (GBP down).
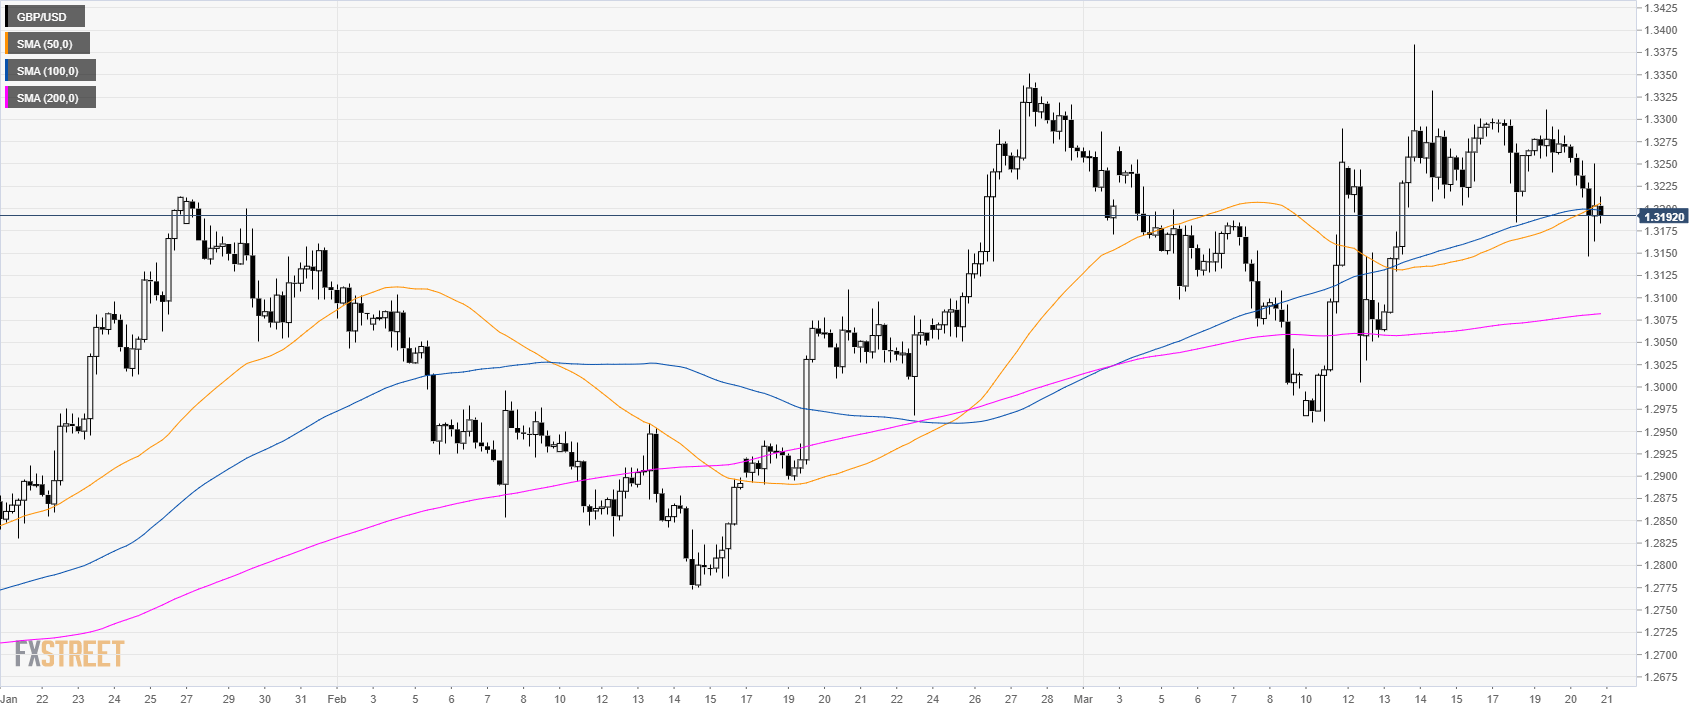
GBP/USD 4-hour chart
- GBP/USD is trading between the 100 and 200 SMAs suggesting a consolidation in the medium-term.
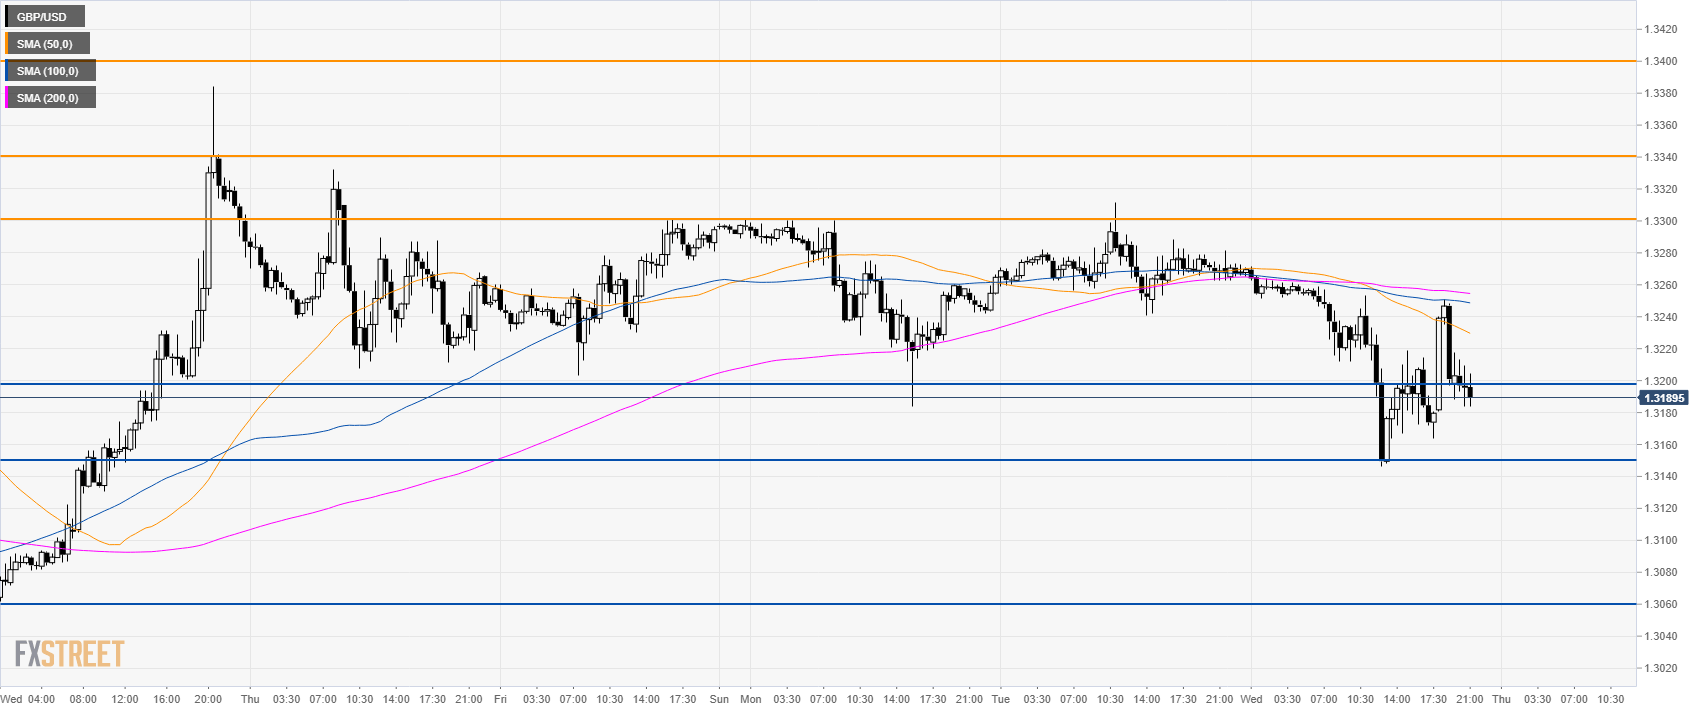
GBP/USD 30-minute chart
- GBP/USD is trading below the 1.3200 figure and its main SMAs suggesting bearish momentum in the short-term.
- Support is at 1.3150 and 1.3060 level.
- To the upside, resistance is at 1.3300 figure and 1.3340 level.
Additional key levels
