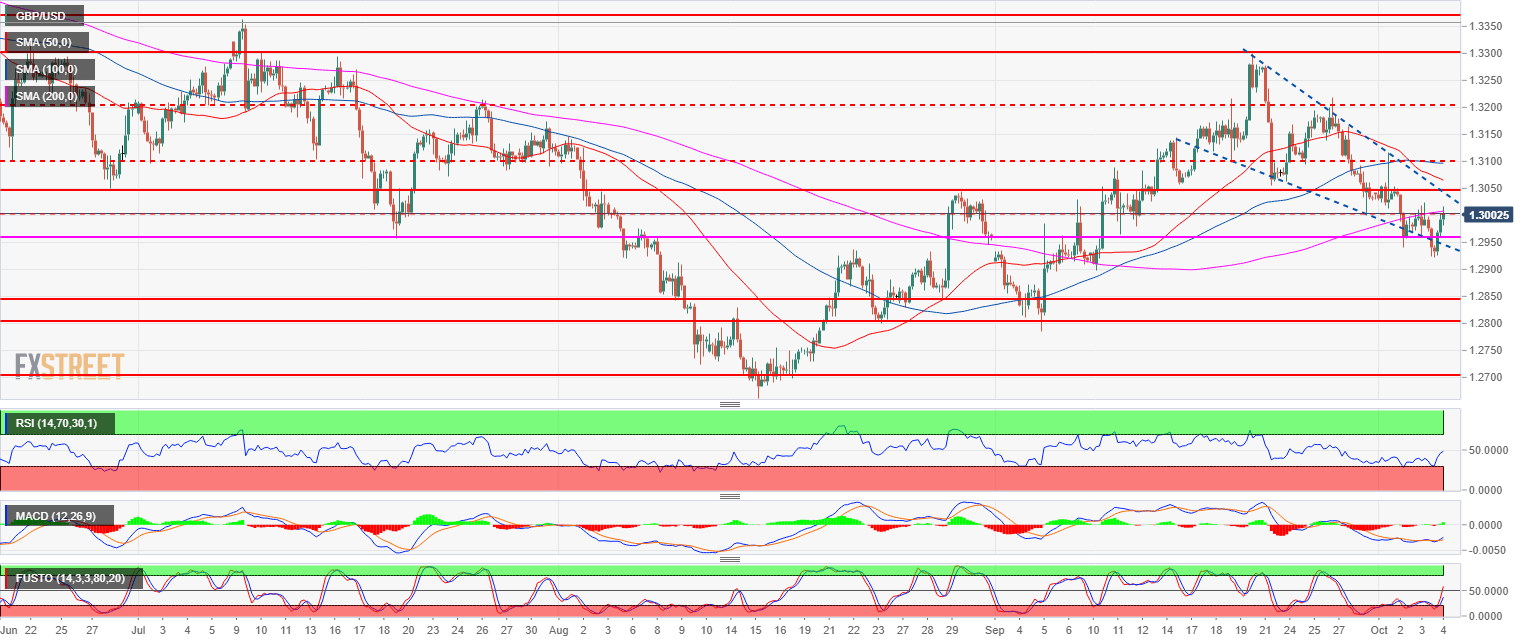
- GBP/USD is trading back above 1.2957 key level as bulls are currently trying to break above 1.3000 figure.
- GBP/USD is trading below its 50, 100-period simple moving averages (SMA) while it is testing the 200 SMA, suggesting an overall bearish bias. GBP/USD is testing yesterday’s high at 1.3022.
- Failure to break above 1.3022 should leave the room open for a swing back down to 1.2957.
Overview:
Last Price: 1.3003
Daily change: 62 pips
Daily change: 0.479%
Daily Open: 1.2941
Trends:
Daily SMA20: 1.3073
Daily SMA50: 1.2975
Daily SMA100: 1.312
Daily SMA200: 1.3503
Levels:
Daily High: 1.3025
Daily Low: 1.2924
Weekly High: 1.3218
Weekly Low: 1.3
Monthly High: 1.33
Monthly Low: 1.2786
Resistances and Supports:
Resistance 1: 1.2957 July 19 swing low
Resistance 2: 1.3000 figure
Resistance 3: 1.3050 August 30 swing high, key level
Resistance 4: 1.3100 figure
Resistance 5: 1.3144 key level
Support 1: 1.2957 July 19 swing low
Support 2: 1.2900 figure
Support 3: 1.2800 figure
Support 4: 1.2700 figure
