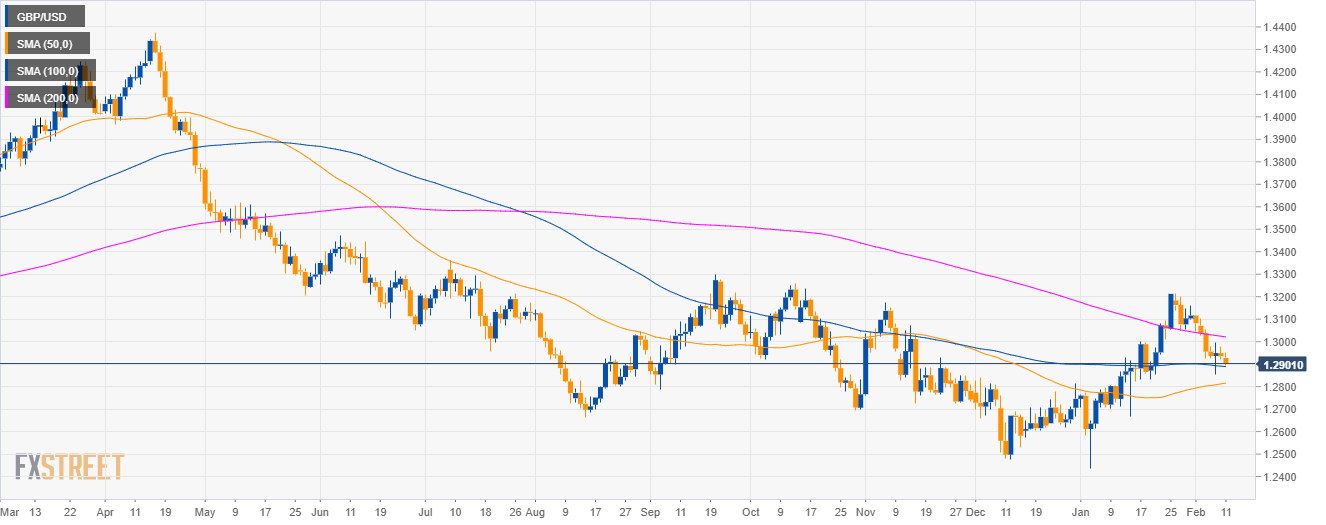
GBP/USD daily chart
- GBP/USD is trading in a bear trend below the 200-day simple moving average.
- The market is currently testing the 100 SMA.
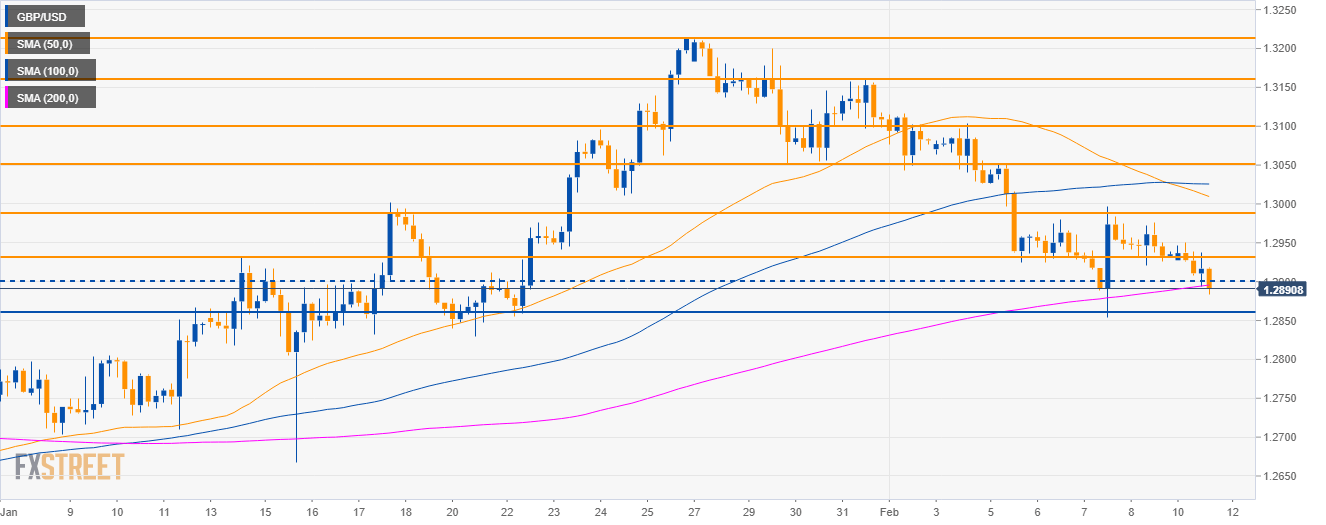
GBP/USD 4-hour chart
- GBP/USD is challenging the 1.2900 figure and the 200 SMA.
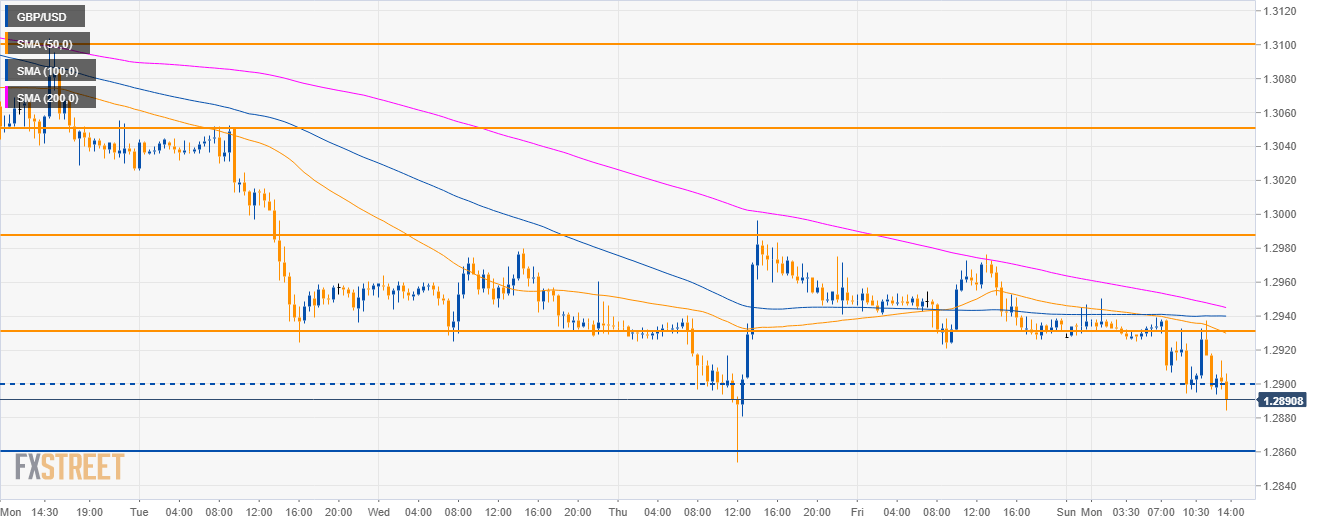
GBP/USD 30-minute chart
- GBP/USD bears are currently breaking the 1.2900 figure suggesting that the market can drop to the 1.2860 support in the short-term.
Additional key levels
GBP/USD
Overview:
Today Last Price: 1.2902
Today Daily change: -33 pips
Today Daily change %: -0.26%
Today Daily Open: 1.2935
Trends:
Daily SMA20: 1.3002
Daily SMA50: 1.2812
Daily SMA100: 1.2891
Daily SMA200: 1.3024
Levels:
Previous Daily High: 1.2976
Previous Daily Low: 1.2921
Previous Weekly High: 1.3103
Previous Weekly Low: 1.2854
Previous Monthly High: 1.3214
Previous Monthly Low: 1.2438
Daily Fibonacci 38.2%: 1.2942
Daily Fibonacci 61.8%: 1.2955
Daily Pivot Point S1: 1.2912
Daily Pivot Point S2: 1.2889
Daily Pivot Point S3: 1.2856
Daily Pivot Point R1: 1.2967
Daily Pivot Point R2: 1.3
Daily Pivot Point R3: 1.3023
