- GBP/USD main bear trend is on hold since mid-August.
- Moments ago, the Core US Consumer Price Index (CPI) for August (y/y) came in at 2.2% versus 2.4% forecast, which is bad news for USD.
- GBP/USD is evolving in a bull channel with rising 50, 100 simple moving averages which are both trading above the 200 SMA. The RSI and Stochastics indicators are equally bullish.
- GBP/USD bulls objective is to strongly break above 1.3050 resistance in order to reach 1.3200 key support and resistance of the last months.
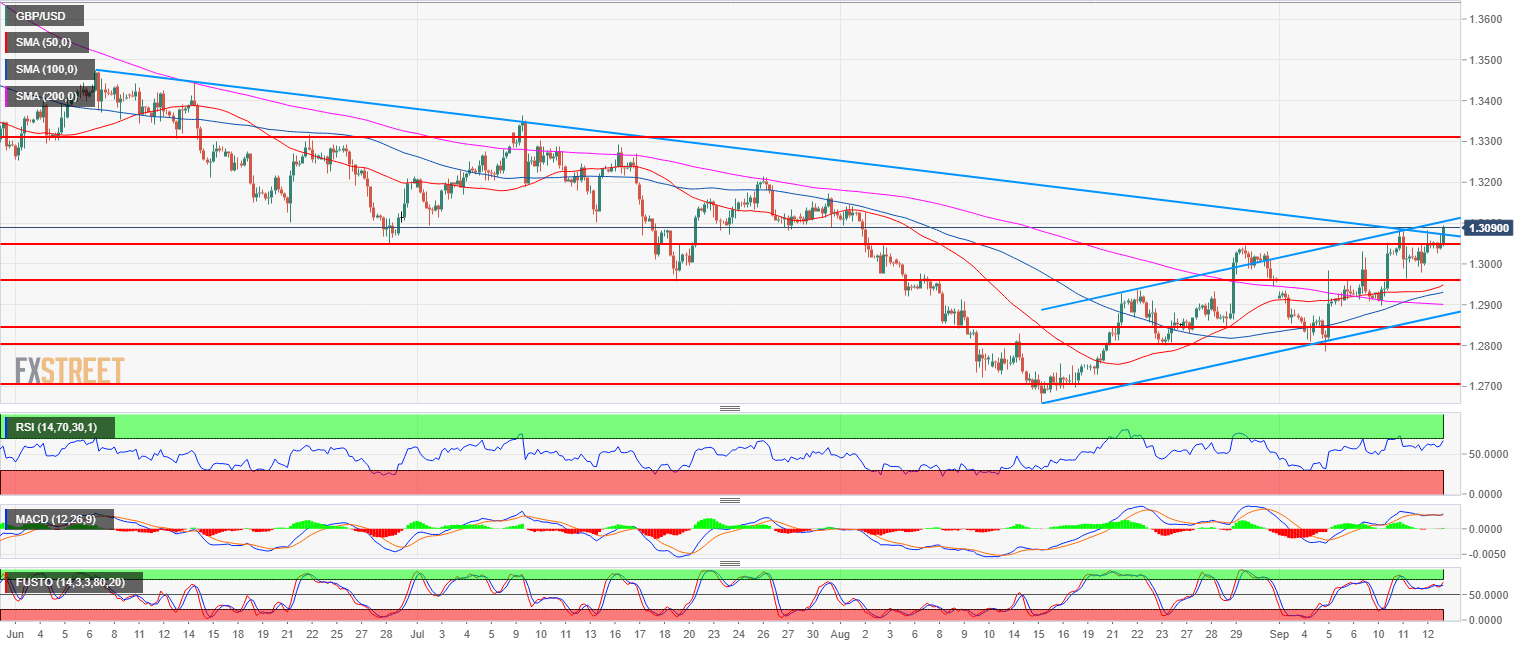
Spot rate: 1.3088
Relative change: 0.32%
High: 1.3093
Low: 1.3026
Main trend: Bearish
Short-term trend: Bullish above 1.2800
Resistance 1: 1.3082-1.3100 supply/demand level and figure
Resistance 2: 1.3200 figure (key support/resistance)
Resistance 3: 1.3300 figure
Support 1: 1.3050 August 30 swing high, key level
Support 2: 1.3000 figure
Support 3: 1.2957 July 19 swing low
Support 4: 1.2937 August 22 swing high
Support 5: 1.2900 figure
Support 6: 1.2868 August 22 low
Support 7: 1.2845, August 29 low
Support 8: 1.2800 August 24 swing low
