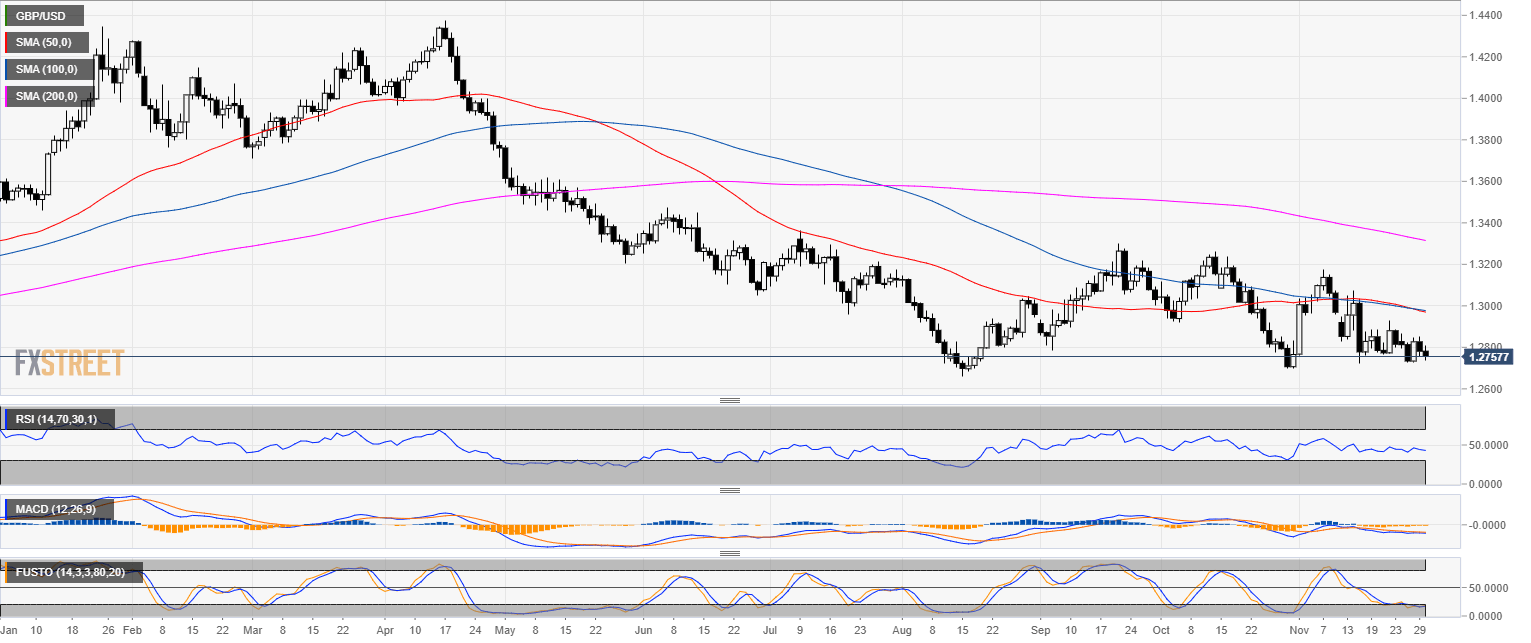
GBP/USD daily chart
- GBP/USD is trading in a bear trend below the 200-day simple moving average (SMA).
- GBP/USD is in a tight trading range for the 10th consecutive day at the November lows.
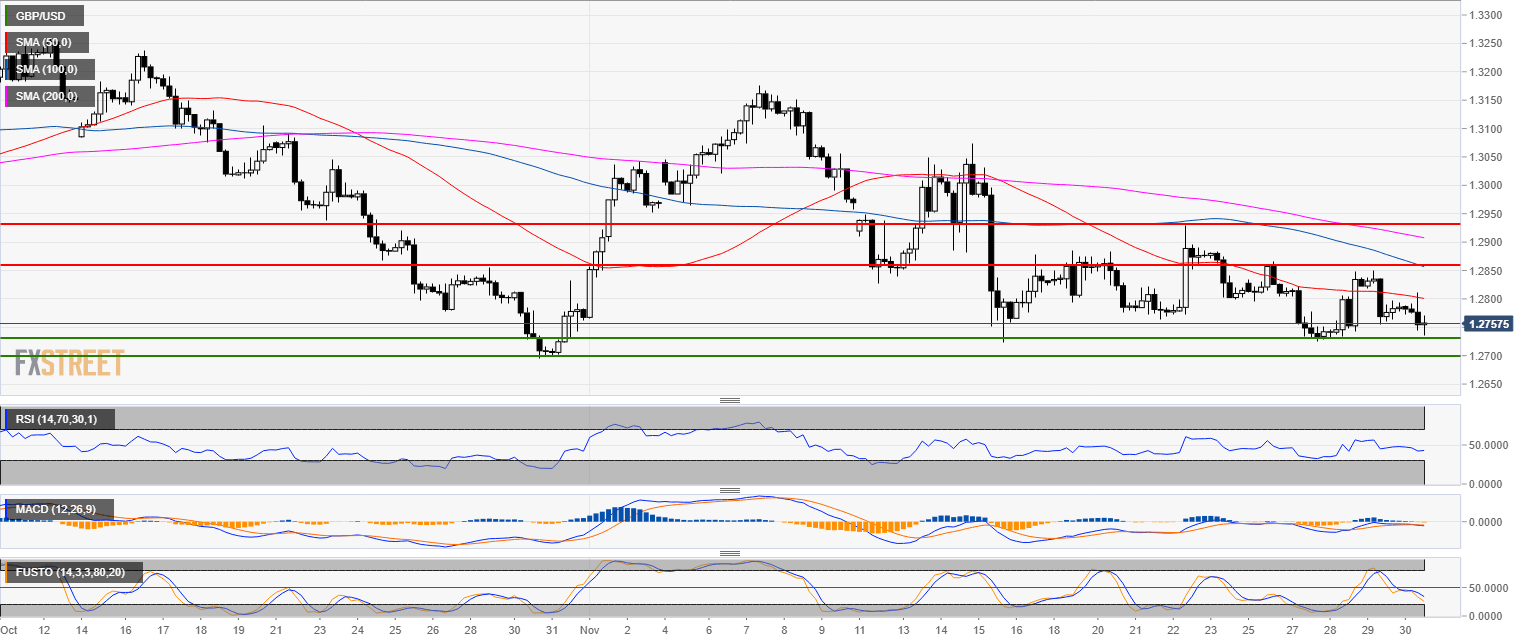
GBP/USD 4-hour chart
- GBP/USD is trading below its main SMAs.
- Technical indicators are slightly negative.
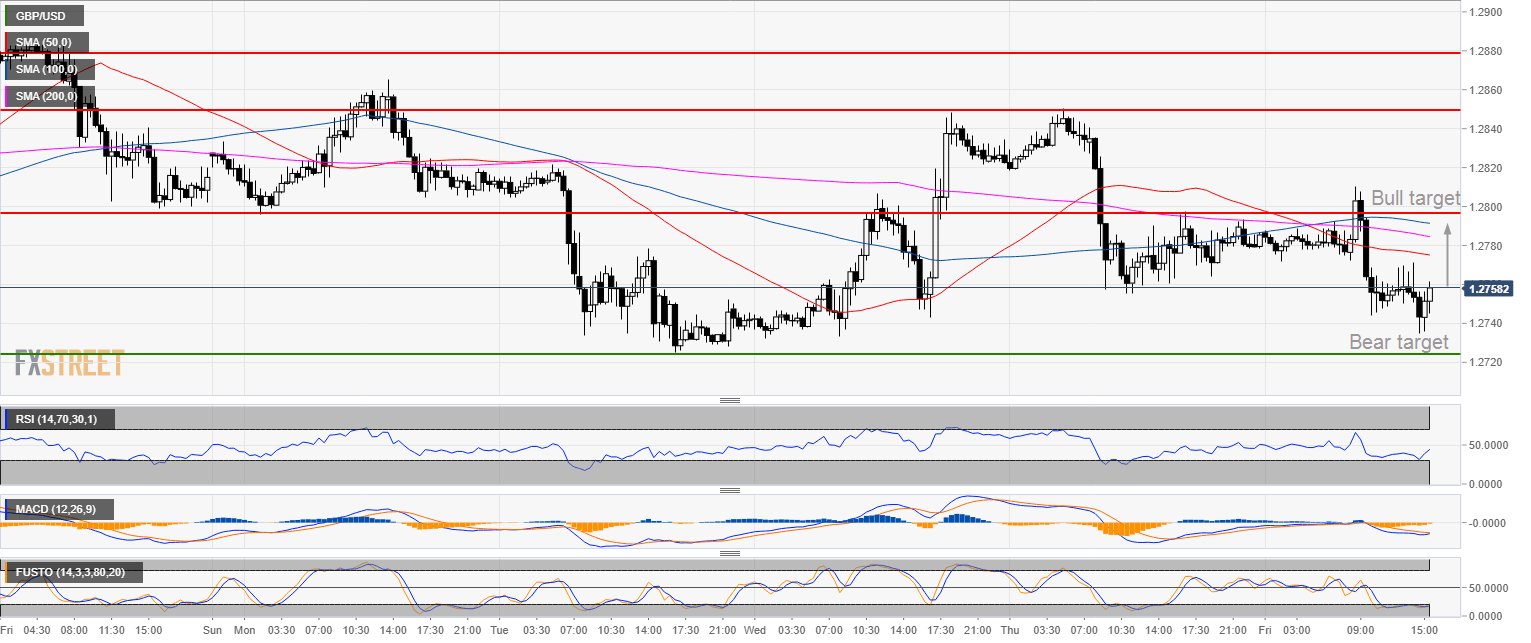
GBP/USD 30-minute chart
- As forecast GBP/USD dropped near 1.2720 level.
- GBP/USD is set to stay supported for the remainder of the day with a potential bull target near 1.2800 figure.
Additional key levels
GBP/USD
Overview:
Today Last Price: 1.2757
Today Daily change: -23 pips
Today Daily change %: -0.180%
Today Daily Open: 1.278
Trends:
Previous Daily SMA20: 1.2898
Previous Daily SMA50: 1.2976
Previous Daily SMA100: 1.2982
Previous Daily SMA200: 1.3323
Levels:
Previous Daily High: 1.2852
Previous Daily Low: 1.2755
Previous Weekly High: 1.2928
Previous Weekly Low: 1.2764
Previous Monthly High: 1.326
Previous Monthly Low: 1.2696
Previous Daily Fibonacci 38.2%: 1.2792
Previous Daily Fibonacci 61.8%: 1.2815
Previous Daily Pivot Point S1: 1.274
Previous Daily Pivot Point S2: 1.2699
Previous Daily Pivot Point S3: 1.2643
Previous Daily Pivot Point R1: 1.2836
Previous Daily Pivot Point R2: 1.2892
Previous Daily Pivot Point R3: 1.2932
