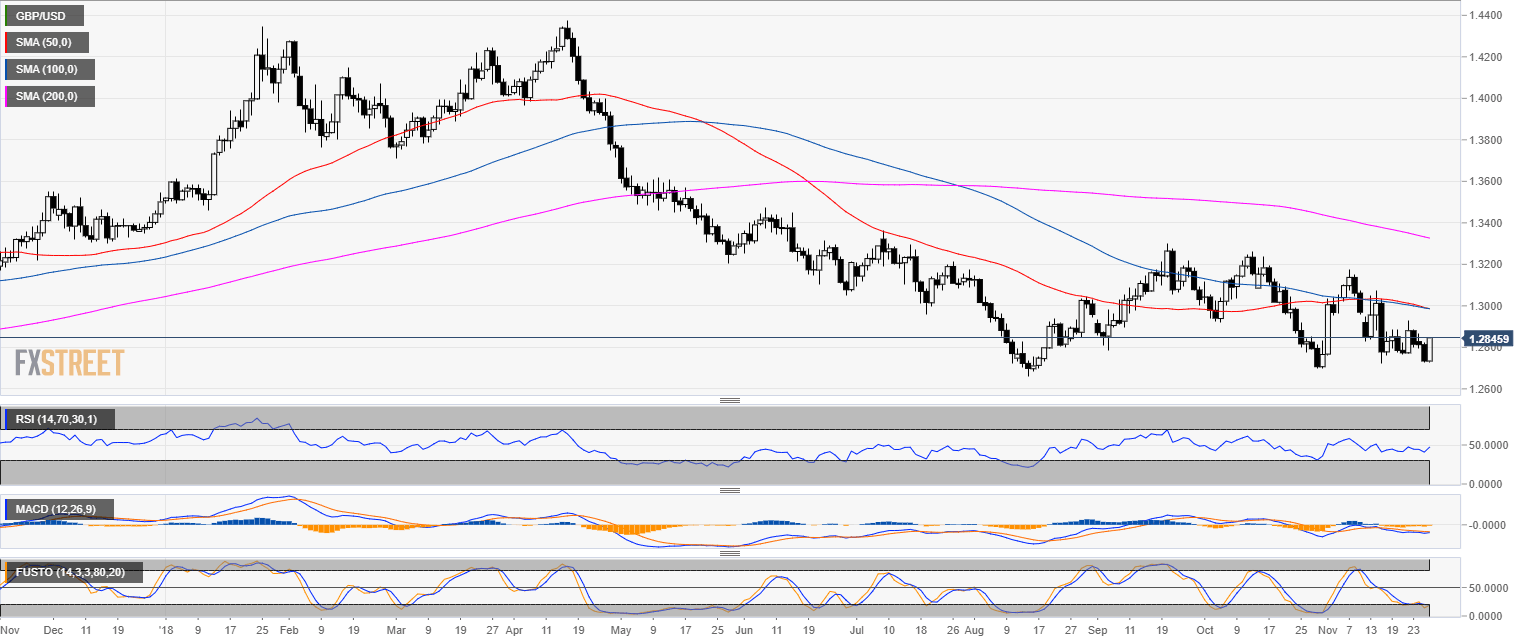
GBP/USD daily chart
- GBP/USD is trading in a bear trend below the 200-day simple moving average.
- GBP/USD has been hovering near the 1.2800 level for the last nine sessions.
- The RSI, MACD and Stochastic are slowly picking up steam.
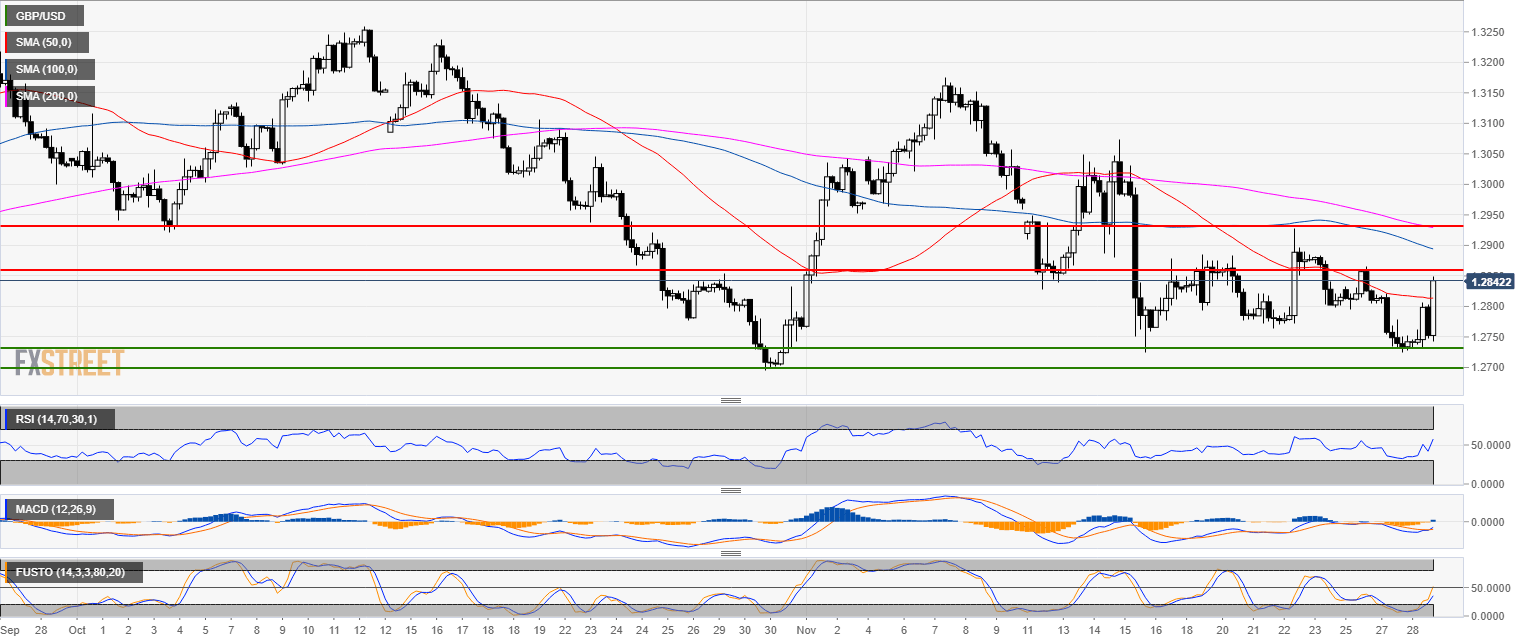
GBP/USD 4-hour chart
- Cable bulls reclaimed the 50 SMA as bulls are en route to 1.2860 and 1.2940 resistance.
- Technical indicators are turning bullish.
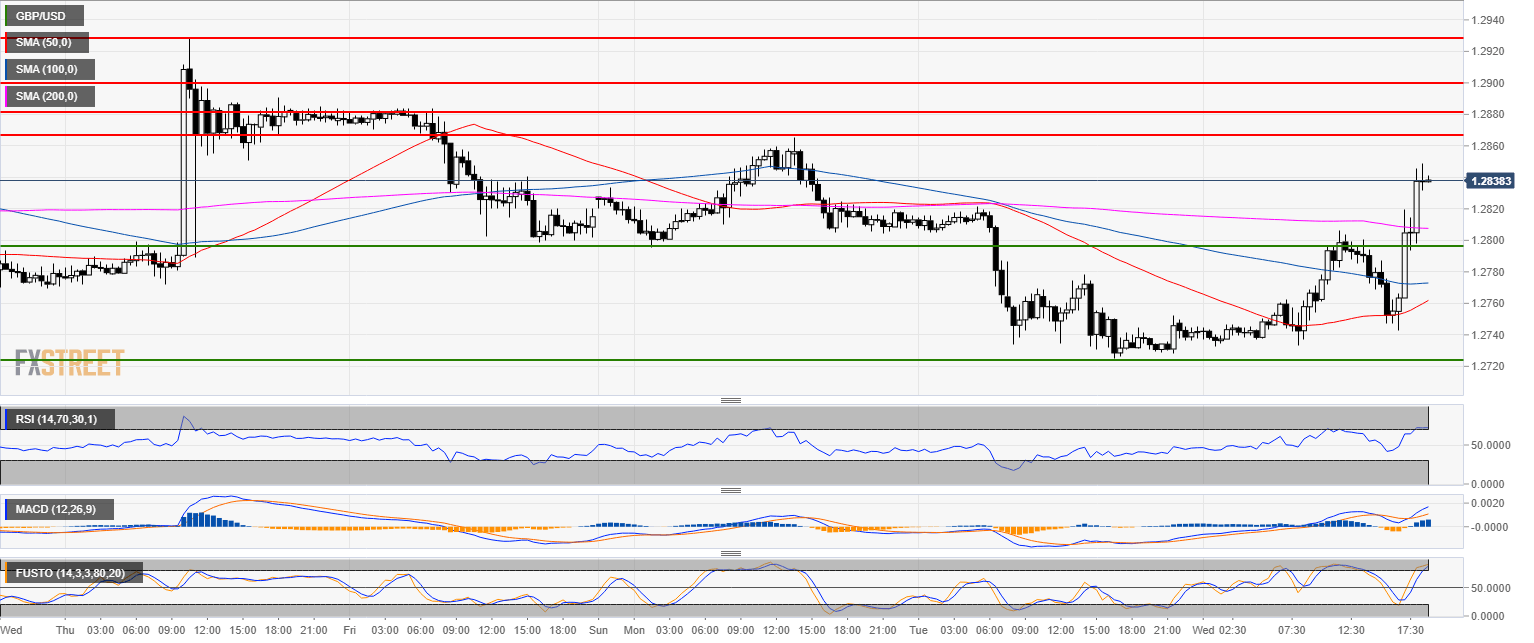
GBP/USD 30-minute chart
- Support is seen at the 1.2800 and 1.2720 levels.
Additional key levels
GBP/USD
Overview:
Today Last Price: 1.2837
Today Daily change: 1.0e+2 pips
Today Daily change %: 0.809%
Today Daily Open: 1.2734
Trends:
Previous Daily SMA20: 1.2906
Previous Daily SMA50: 1.2992
Previous Daily SMA100: 1.299
Previous Daily SMA200: 1.3335
Levels:
Previous Daily High: 1.2836
Previous Daily Low: 1.2725
Previous Weekly High: 1.2928
Previous Weekly Low: 1.2764
Previous Monthly High: 1.326
Previous Monthly Low: 1.2696
Previous Daily Fibonacci 38.2%: 1.2767
Previous Daily Fibonacci 61.8%: 1.2793
Previous Daily Pivot Point S1: 1.2694
Previous Daily Pivot Point S2: 1.2654
Previous Daily Pivot Point S3: 1.2584
Previous Daily Pivot Point R1: 1.2805
Previous Daily Pivot Point R2: 1.2875
Previous Daily Pivot Point R3: 1.2915
