- GBP/USD is correcting the Boris Johnson-inspired selloff.
- Immediate support can be seen at 1.2190 and 1.2165 levels.
- The FOMC meeting at 18:00 GMT can spark high volatility on the Cable.
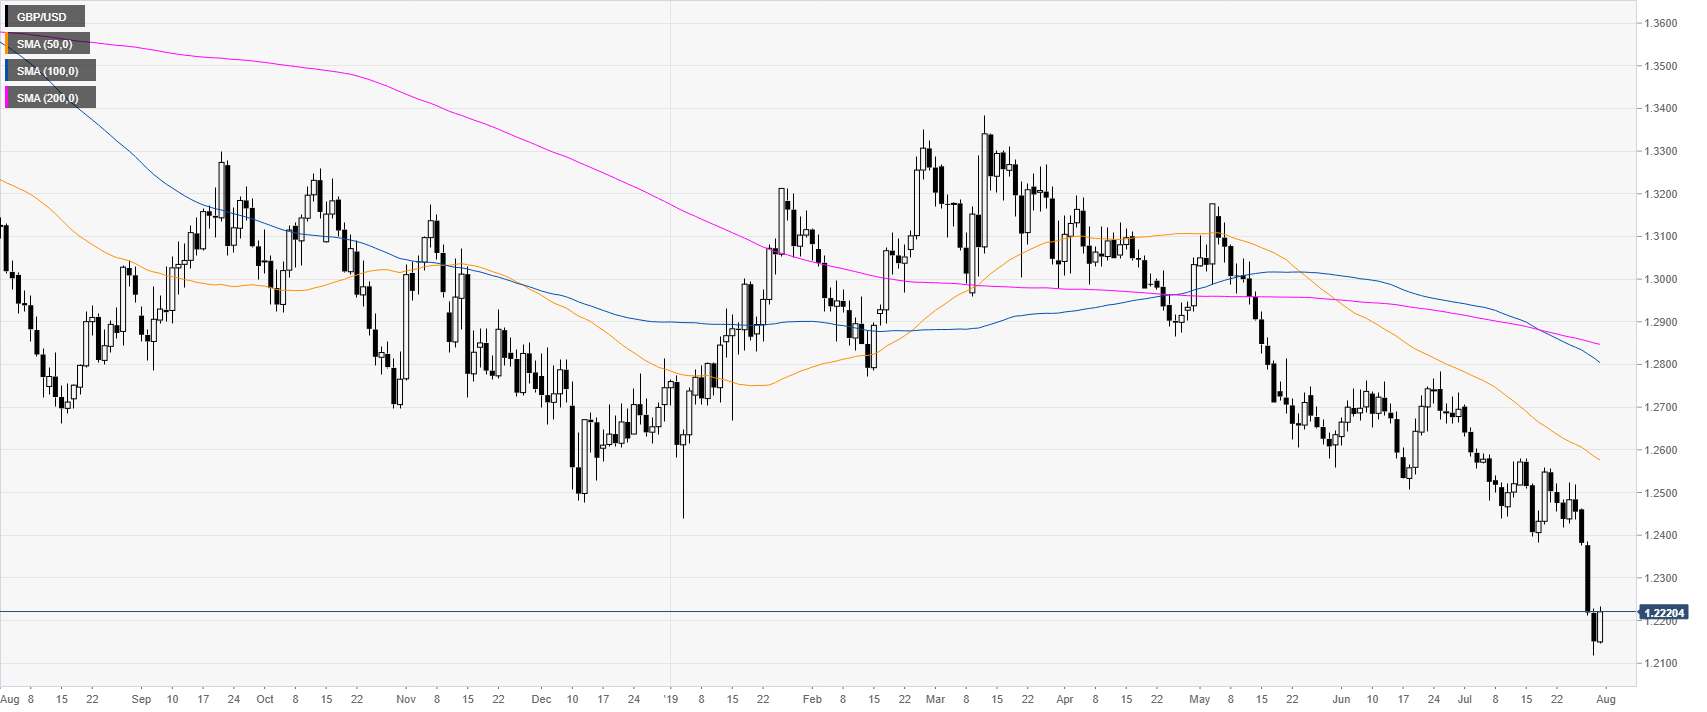
GBP/USD daily chart
Cable is correcting some of the losses triggered by UK PM Boris Johnson in the first two days of the week. The prospect of a no-deal Brexit sent the Pound down across the board. Later on at 18:00 GMT, the FOMC meeting can cause high volatility. The Federal Reserve is expected to cut 25bps. The market will pay close attention to Fed’s Chairman Powell comments.
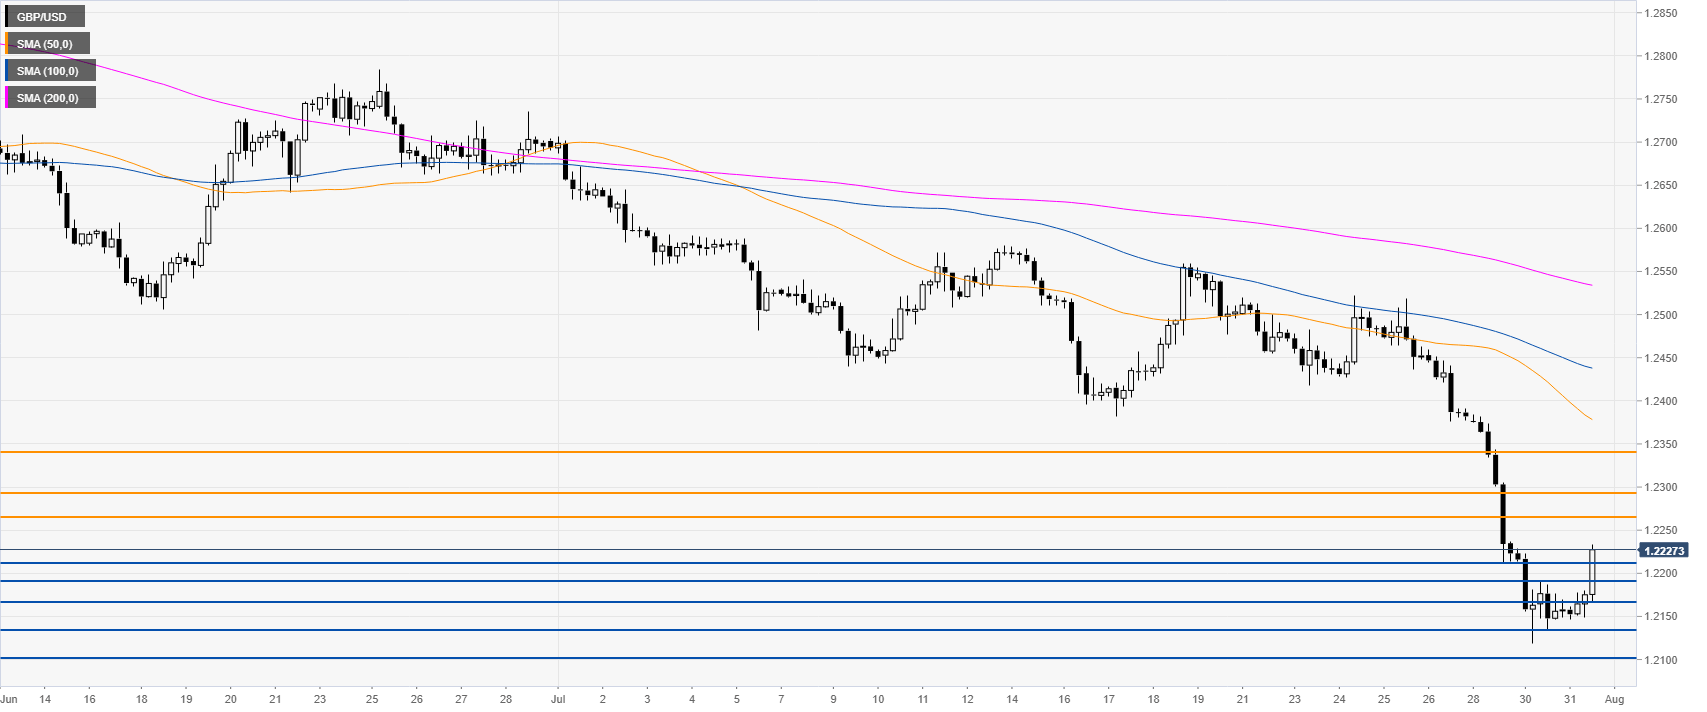
GBP/USD 4-hour chart
GBP/USD broke above 1.2216 resistance as it is challenging the Wednesday high. The correction up can extend towards 1.2266 and 1.2291 according to the Technical Confluences Indicator.
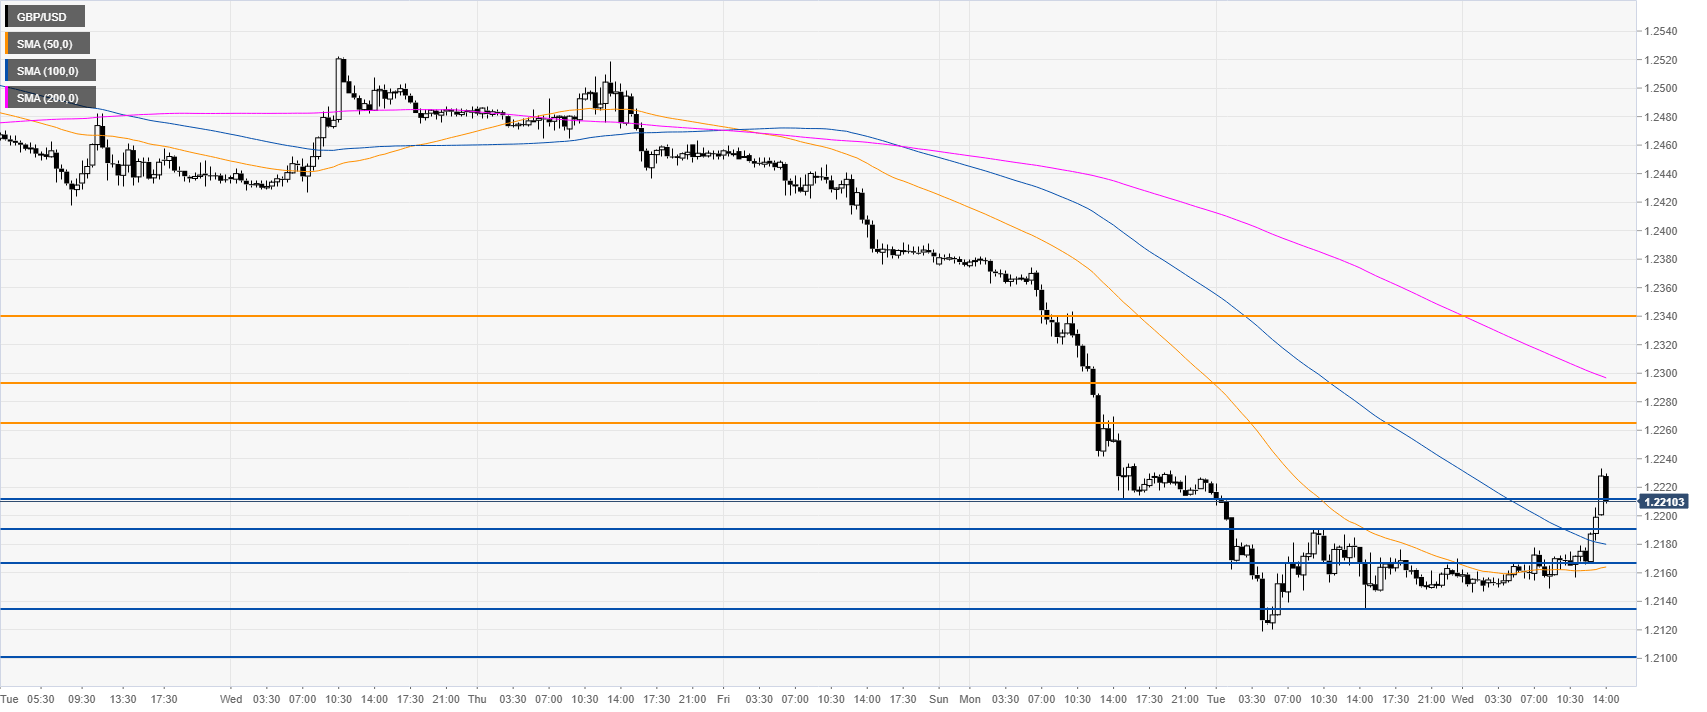
GBP/USD 30-minute chart
Cable is trading above the 50/100 SMAs suggesting a correction up in the short term. Support can be seen at 1.2190, 1.2165, 1.2133 and 1.2100 according to the Technical Confluences Indicator.
Additional key levels
