- The Sterling is stuck in a range below the 1.2500 figure.
- The level to beat for buyers is the 1.2515 price level near multi-week highs.
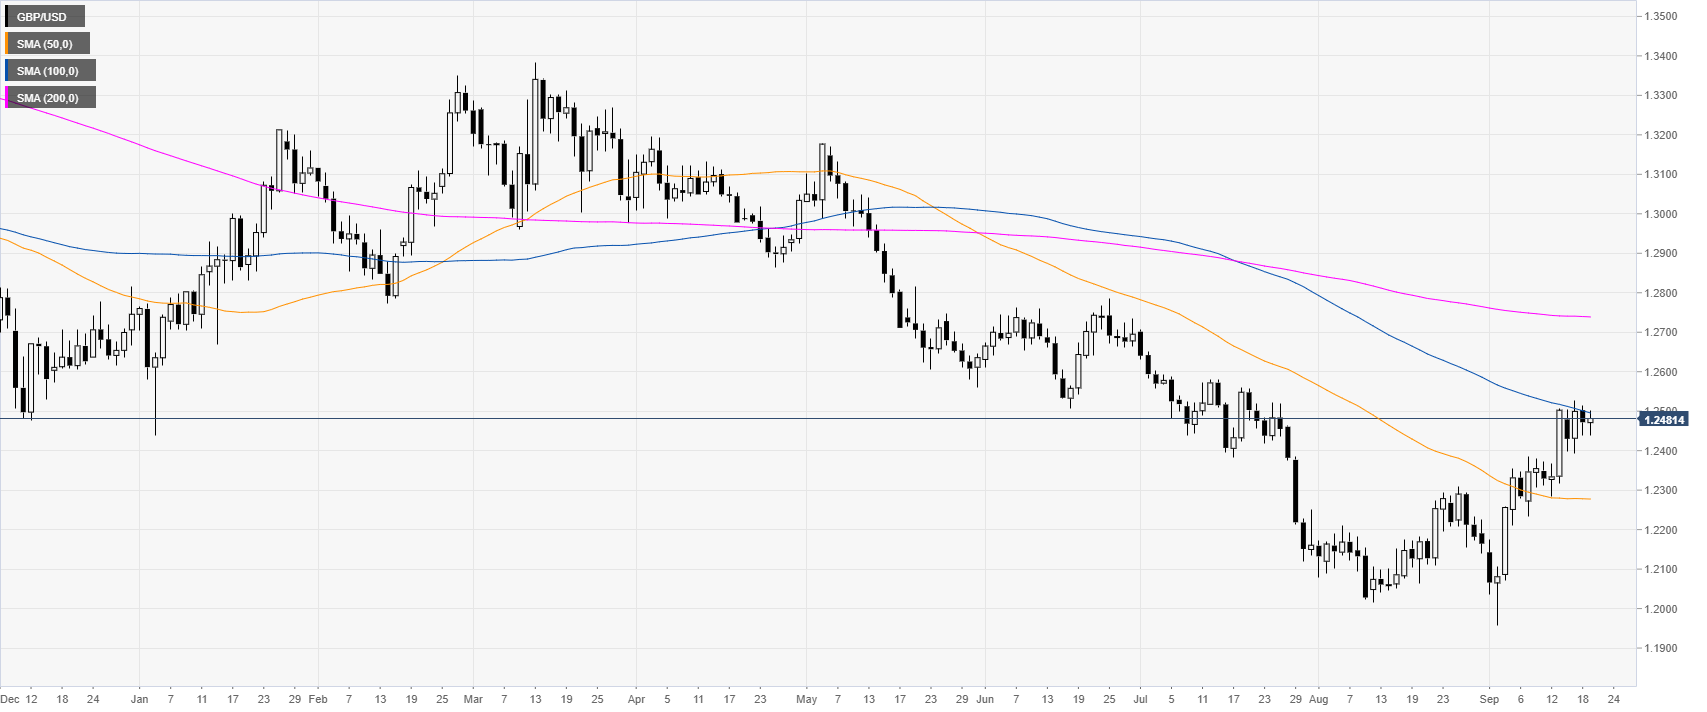
GBP/USD daily chart
The Sterling is trading in a bear trend below the 100 and 200-day simple moving averages (SMAs). However, GBP/USD has been rebounding in Septembre now challenging the 1.2500 figure for the last five days.
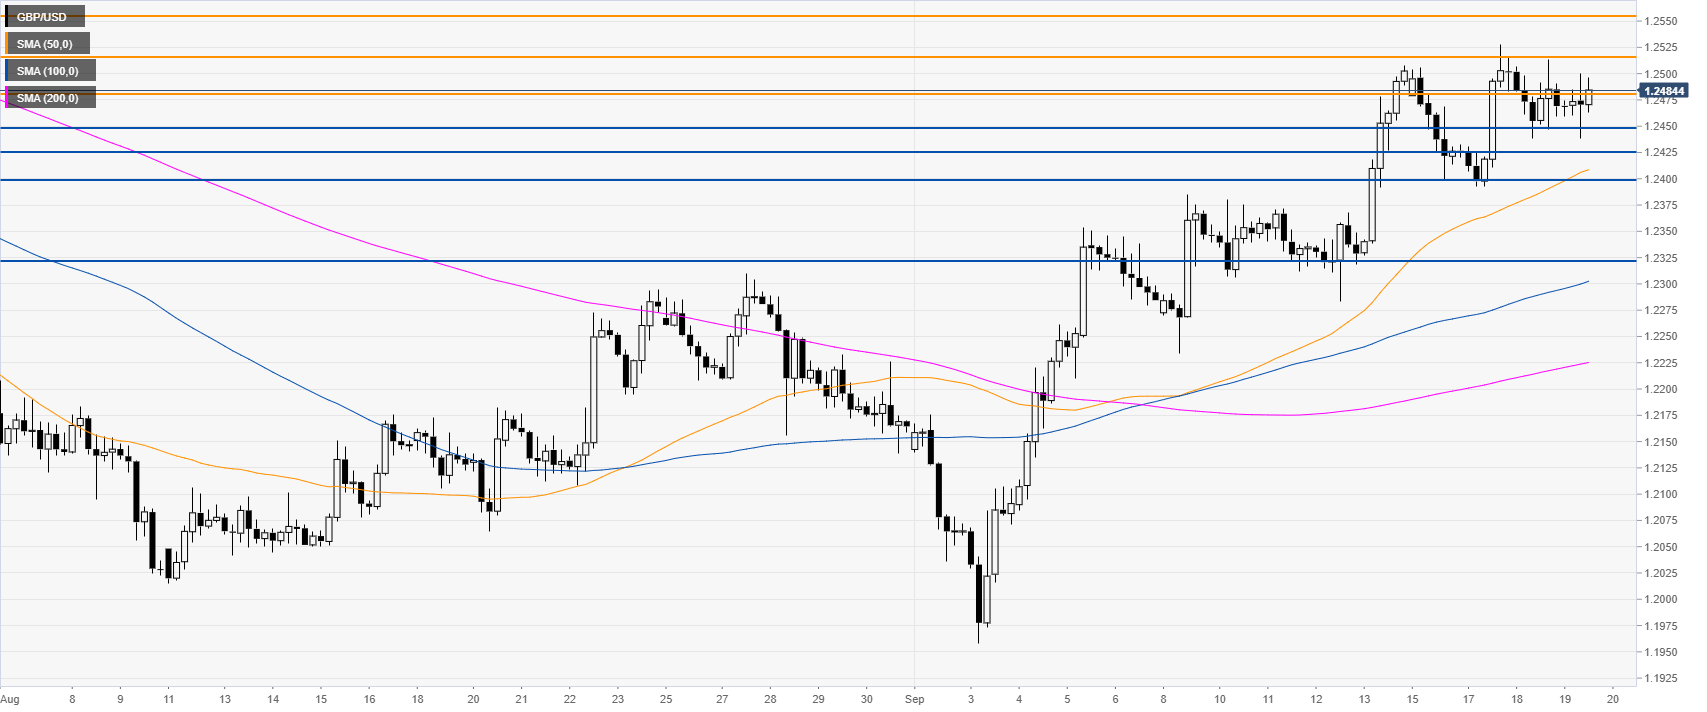
GBP/USD four-hour chart
The Pound is trading above the main SMAs, suggesting bullish momentum in the medium term. The market is challenging the 1.2480 resistance as bulls want to continue the up move towards 1.2515, 1.2554 resistances, according to the Technical Confluences Indicator. However, the market has been two-sided in the last week and it remains to be seen if the break above 1.2515 will indeed materialize.
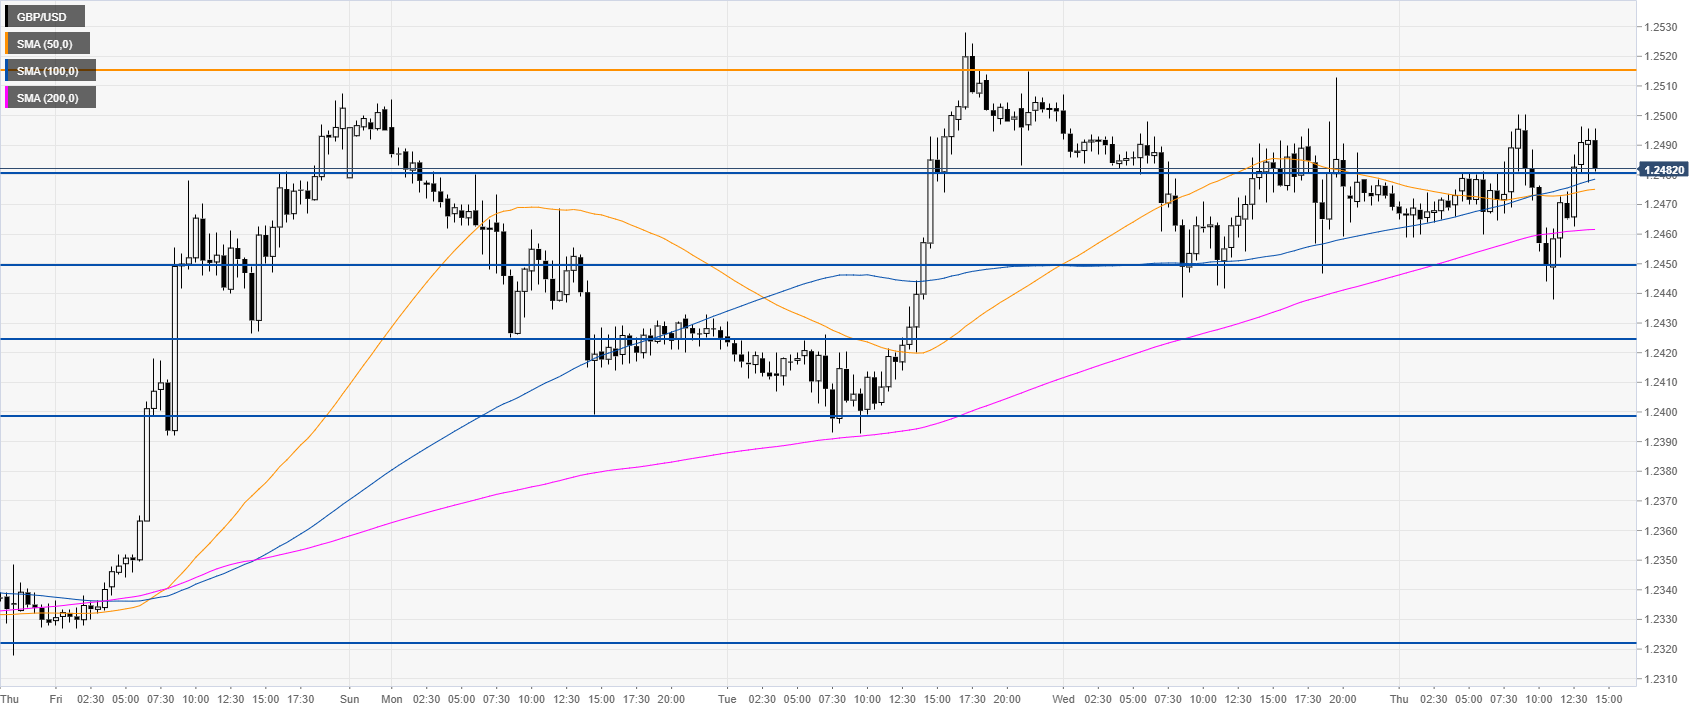
GBP/USD 30-minute chart
GBP/USD is trading near the daily highs just above the 1.2480, which is acting as support. The market is choppy and investors are searching for a clear direction. If 1.2480 gets broken to the downside, then 1.2450 can come back int play. Further down lie the 1.2425 support and the 1.2400 figure, according to the Technical Confluences Indicator.
Additional key levels
