- GBP/USD is holding to levels not seen since mid-May of this year.
- GBP/USD is trading above the 1.2840 level after the London close.
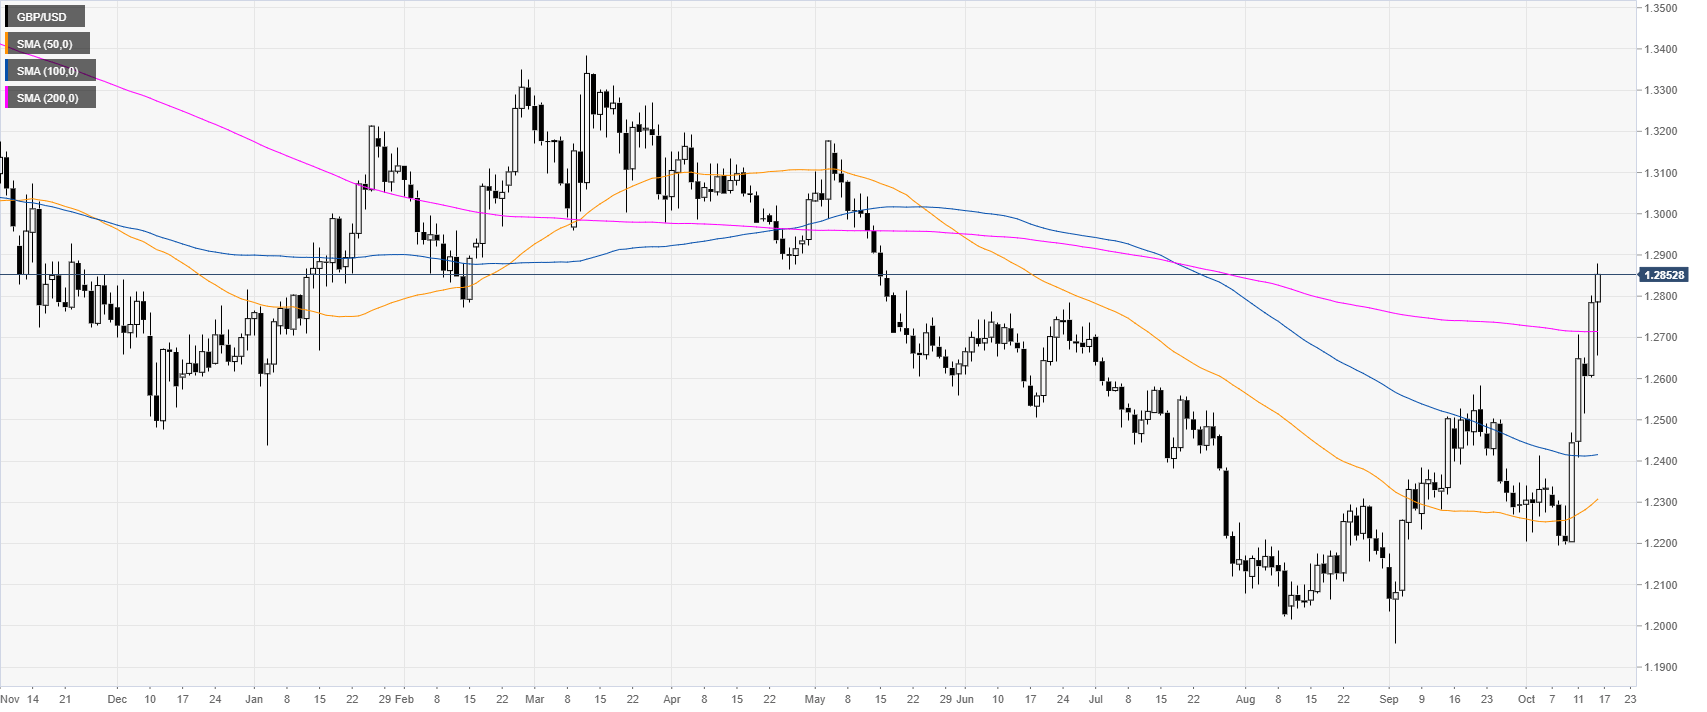
GBP/USD daily chart
The Sterling, on the daily chart, is trading above its 200-day simple moving average (DSMA). Earlier in the New York session, GBP/USD leaped above 1.2800 as the DUP (Democratic Unionist Party) reportedly accepted Brexit proposals on consent. GBP/USD is trading at its highest level since mid-May 2019.
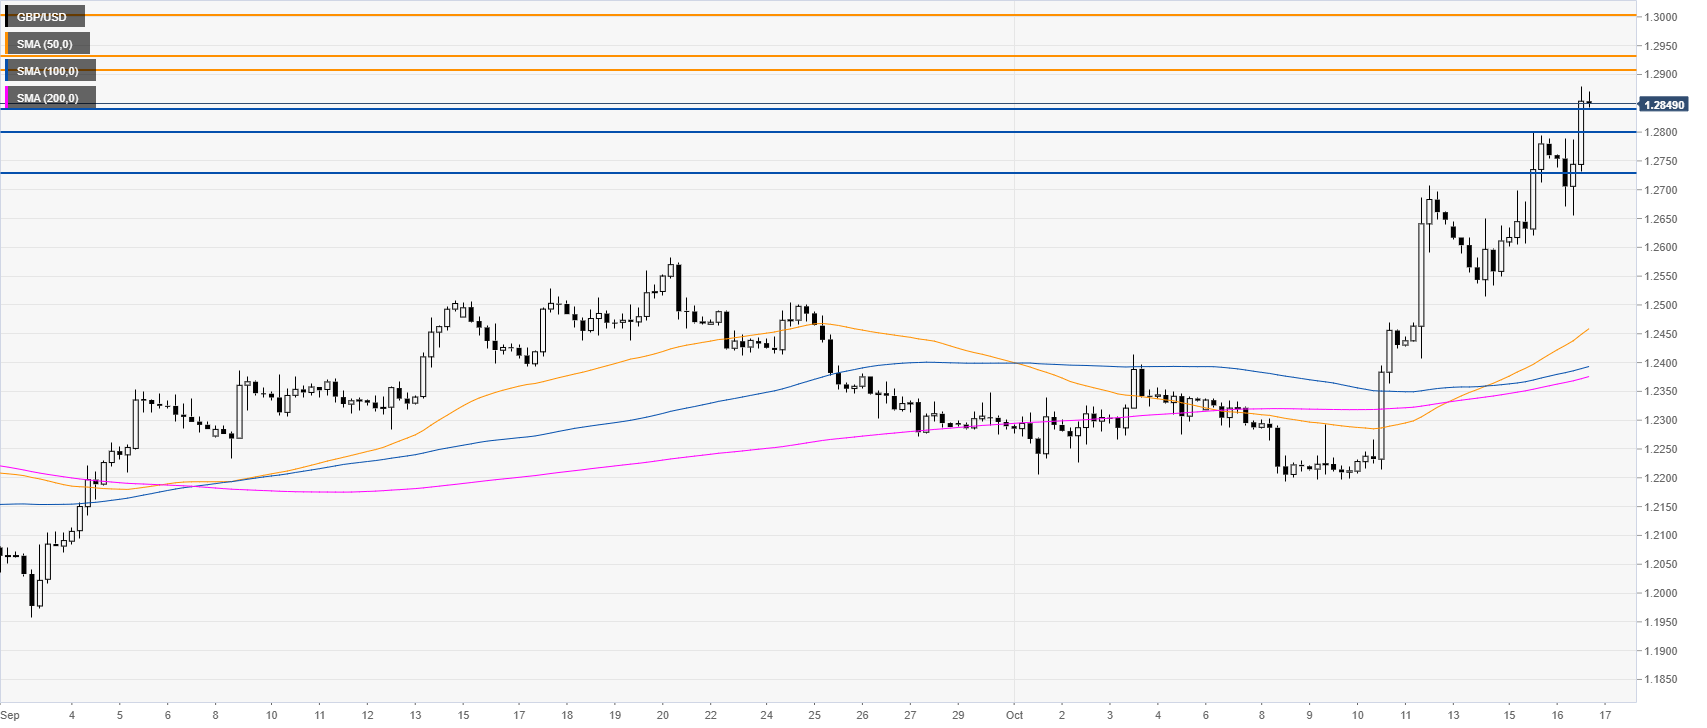
GBP/USD four-hour chart
GBP/USD is clinging to daily and monthly highs while trading above the main SMAs. The intense bullish pressure can see the 1.2907/1.2934 and 1.3000 figure challenged in the coming sessions.
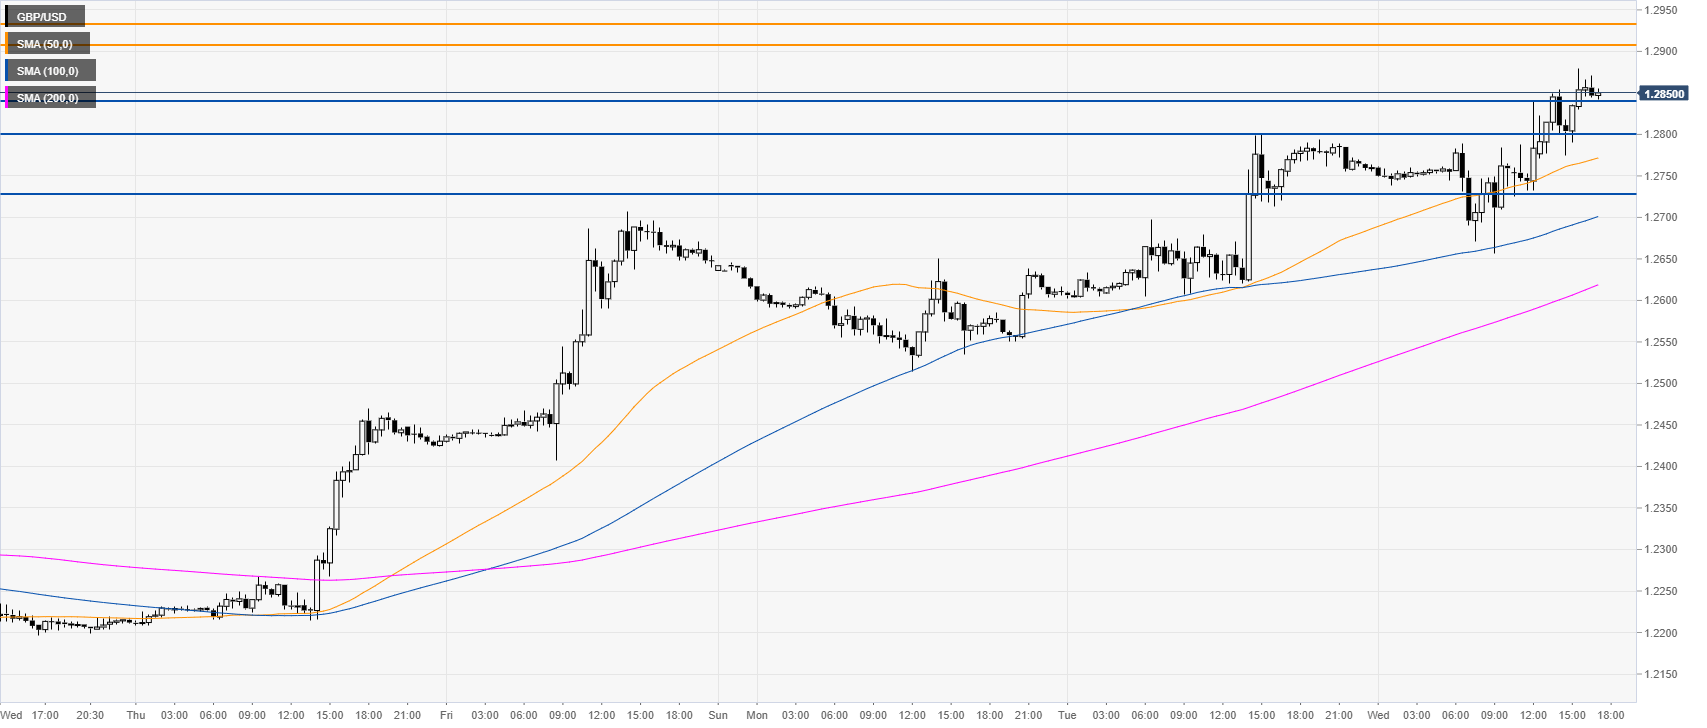
GBP/USD 30-minute chart
GBP/USD is trading above its main SMAs, suggesting bullish momentum in the near term. Support is at the 1.2840 level, the 1.2800 figure and the 1.2733 level, according to the Technical Confluences Indicator.
Additional key levels
