- GBP/USD is consolidating near 1.2538 support.
- Immediate resistance is seen at 1.2570 according to the Technical Confluences Indicator.
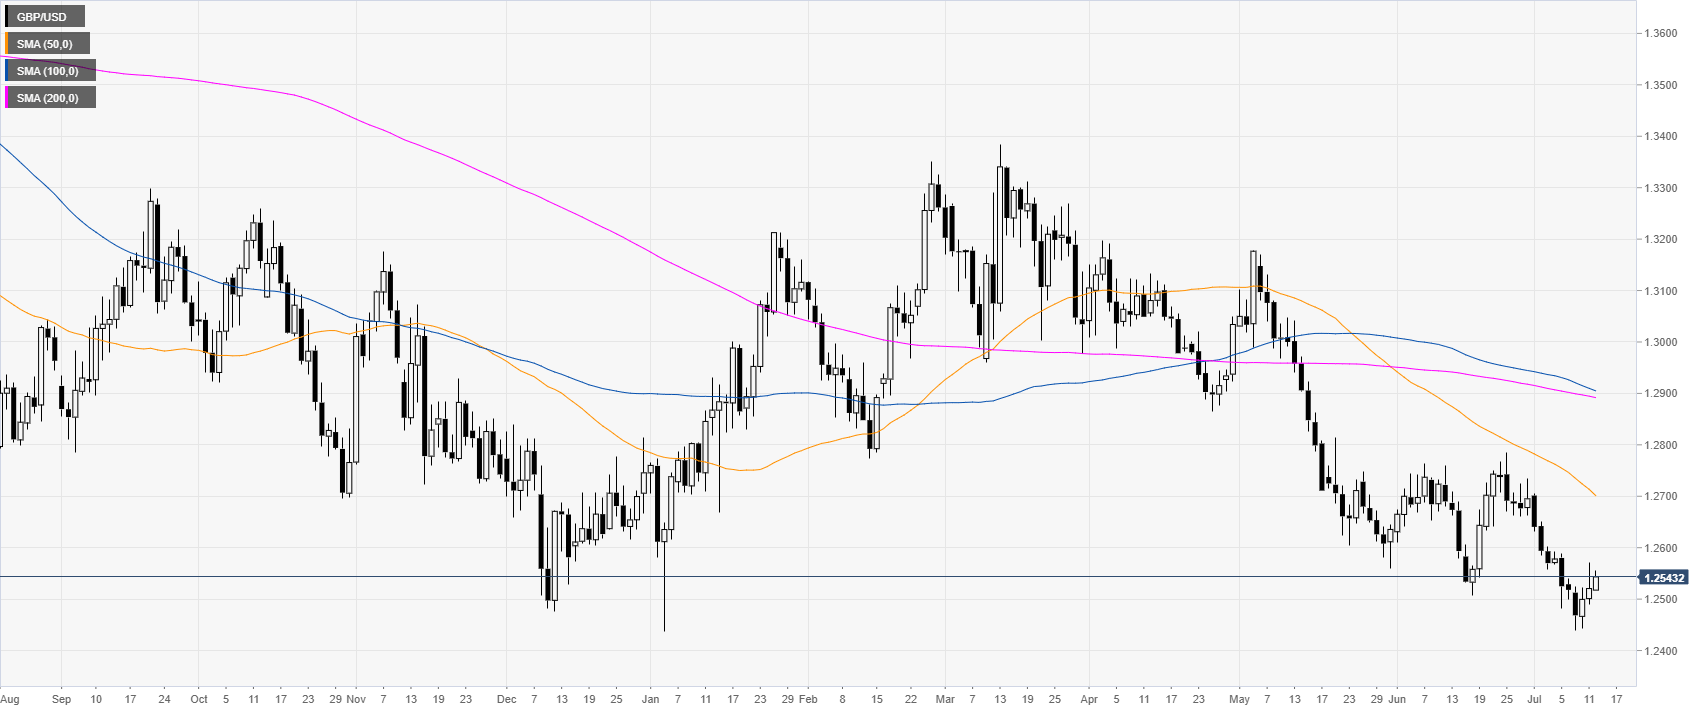
GBP/USD daily chart
GBP/USD is trading in a bear trend below its main daily simple moving averages (DSMAs). The market is correcting up above the 1.2500 figure.
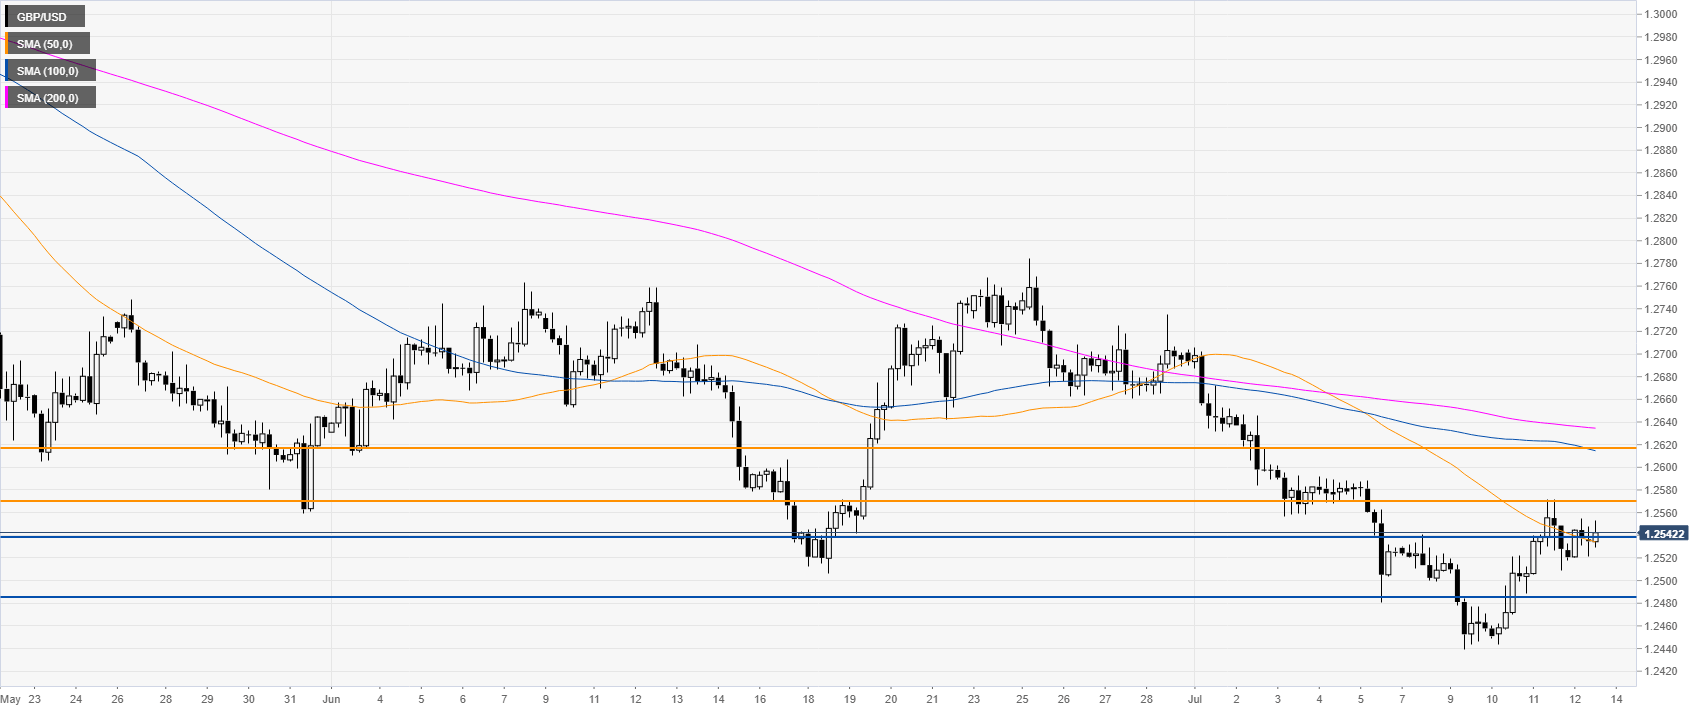
GBP/USD 4-hour chart
GBP/USD is coiling around 1.2538 support and the 50 SMA. The market is trading below its 100 and 200 SMAs suggesting a bearish bias.

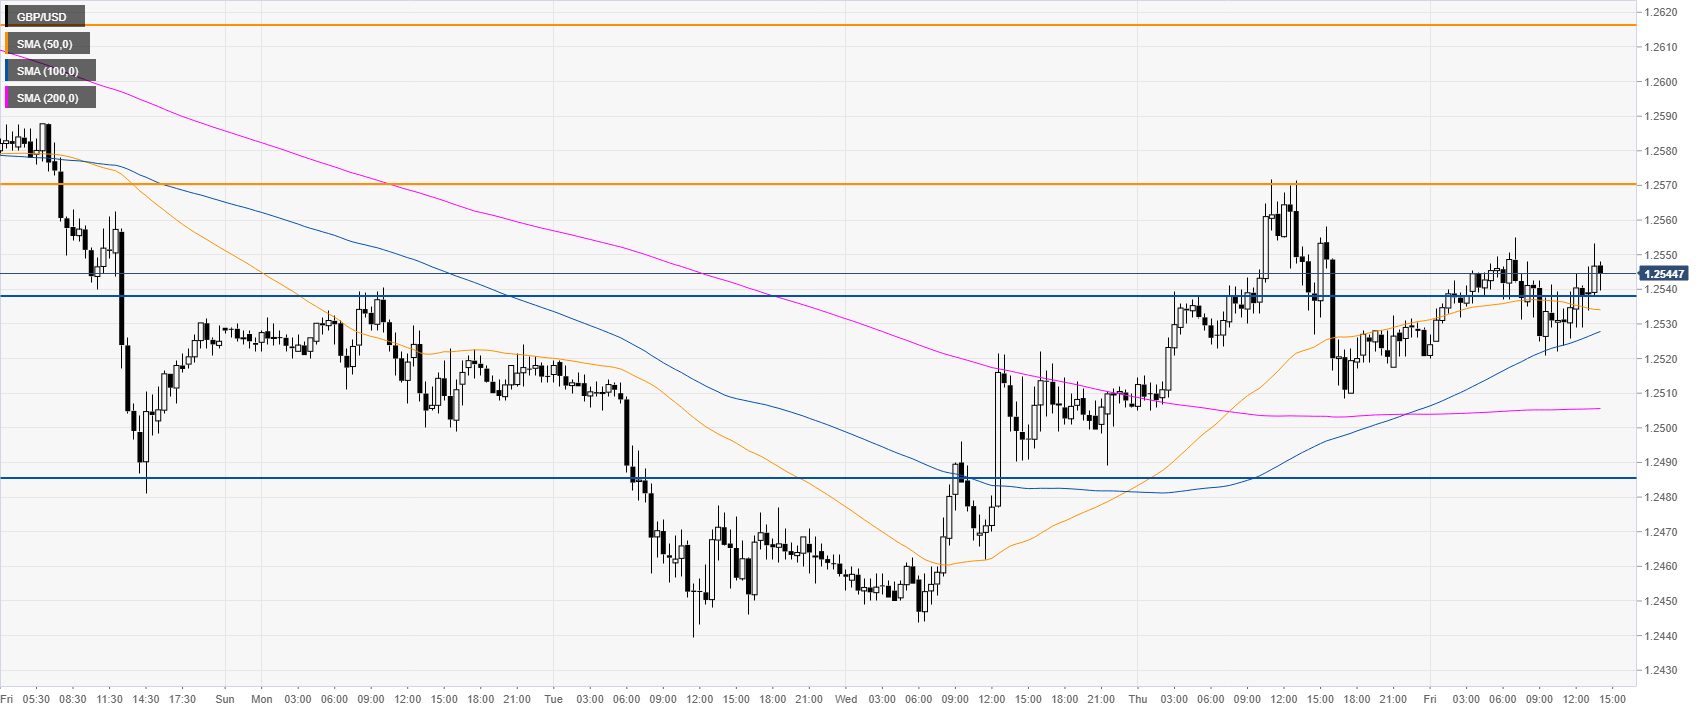
GBP/USD 30-minute chart
GBP/USD is trading below Thursday’s high and 1.2570. However GBP/USD is trading above its main SMAs suggesting that bears have still work to do to potentially resume the bear trend. Resistances can be seen near 1.2570 and 1.2617, according to the Technical Confluences Indicator.
Additional key levels
