- GBP/USD is in a bear trend below the 200-period simple moving average on the 4-hour chart.
- GBP/USD is currently trading in a range between the 1.2800 and 1.2850 level. The currency pair is oversold suggesting that a break above 1.2850 on a daily closing basis can lead to further upside in the coming sessions with 1.2900 figure back on the radar.
- On the flip side, a daily close below 1.2800 figure might lead to more bearishness.
GBP/USD 4-hour chart
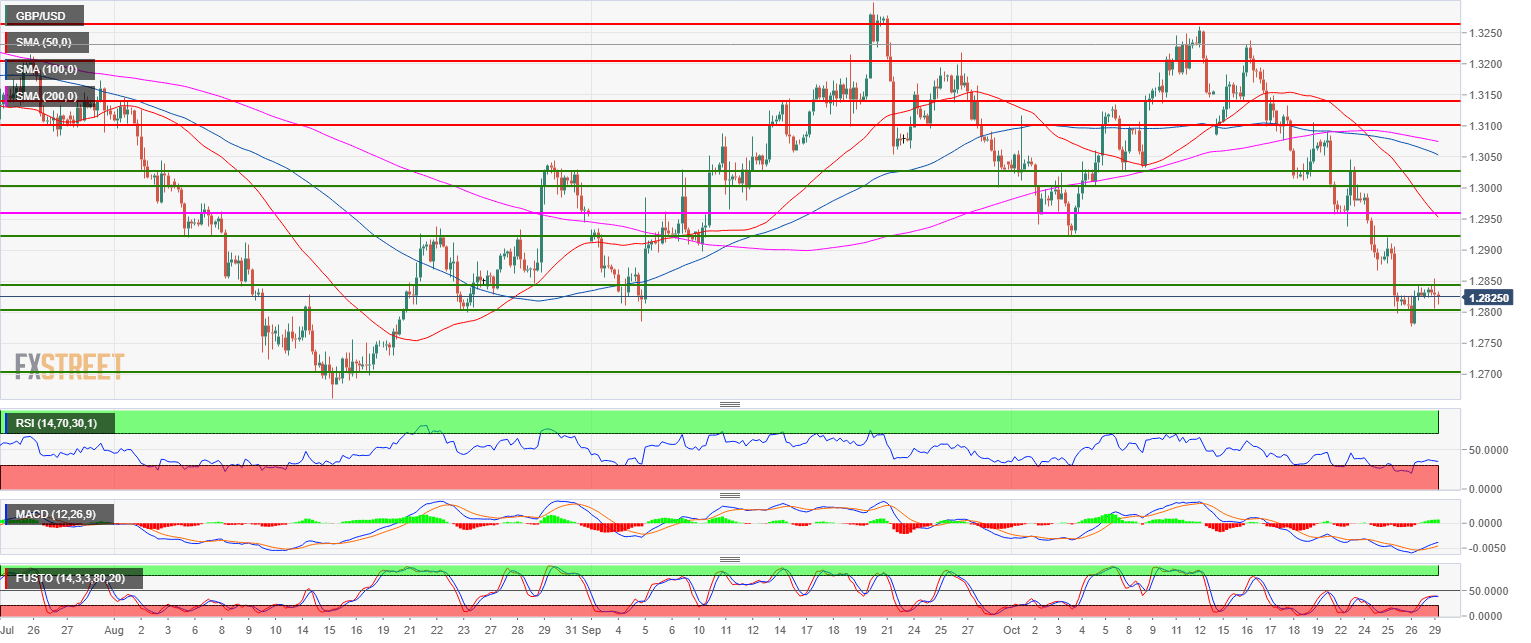
Spot rate: 1.2821
Relative change: -0.04%
High: 1.2854
Low: 1.2806
Main trend: Bearish
Resistance 1: 1.2846 August 29 low
Resistance 2: 1.2900 figure
Resistance 3: 1.2921 October 4 low
Support 1: 1.2800 figure
Support 2: 1.2750 figure
Support 3: 1.2700 figure
Support 4: 1.2660 August low
