- GBP/USD bear trend is intact as the market fell to new multi-month lows this Monday.
- The levels to beat for sellers are seen at 1.2060 and 1.2036 supports.
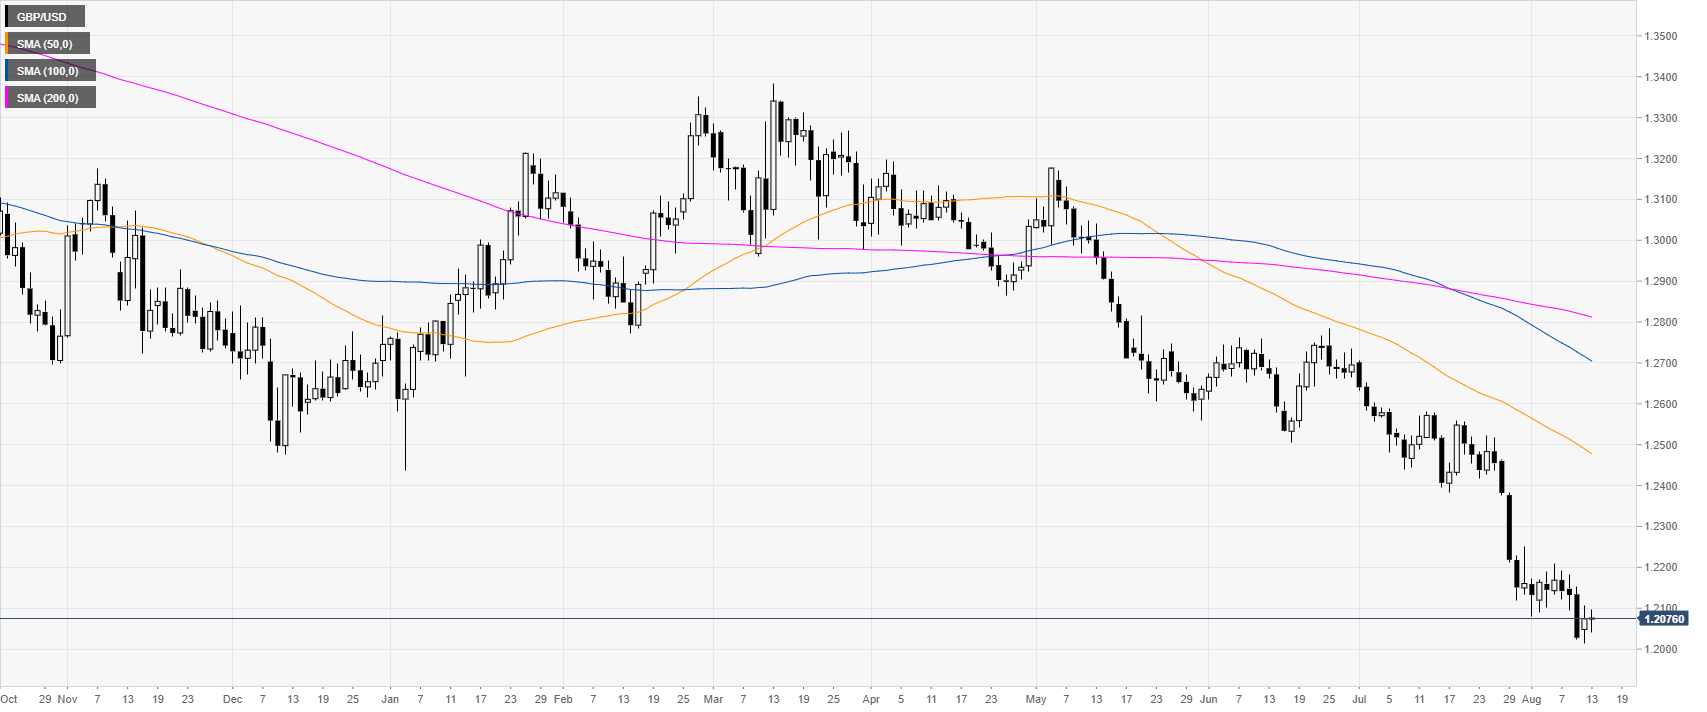
GBP/USD daily chart
Cable is under bearish pressure as the market reached a new multi-month lows at the 1.2015 level this Monday.
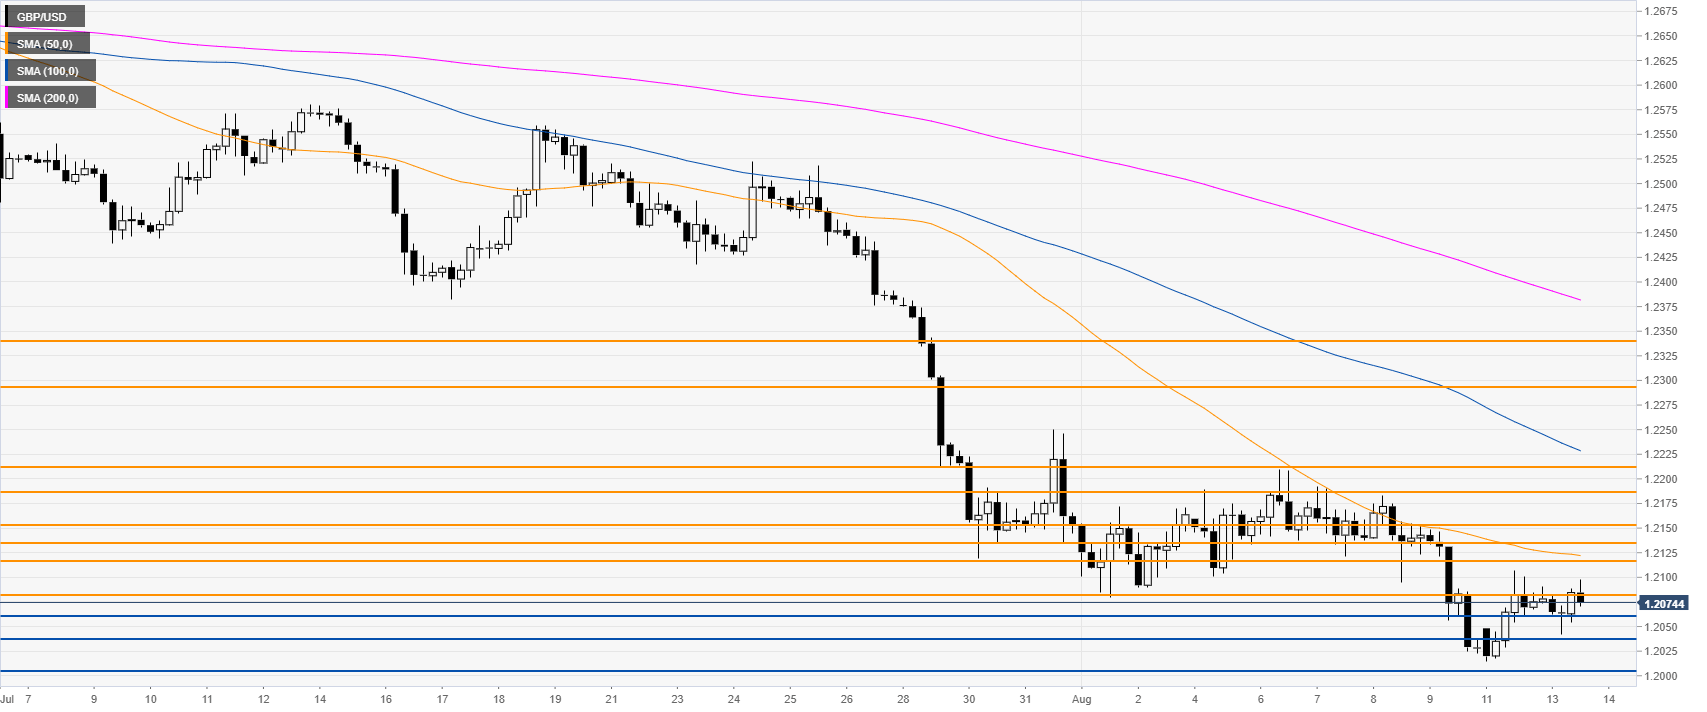
GBP/USD 4-hour chart
GBP/USD is trading below its main simple moving averages (SMAs), suggesting a bearish bias in the medium term. The market is rejecting the 1.2085 resistance. Bulls have a lot of resistance ahead such as the 1.2085 and 1.2116 resistances, followed by the 1.2135 and 1.2154 levels.
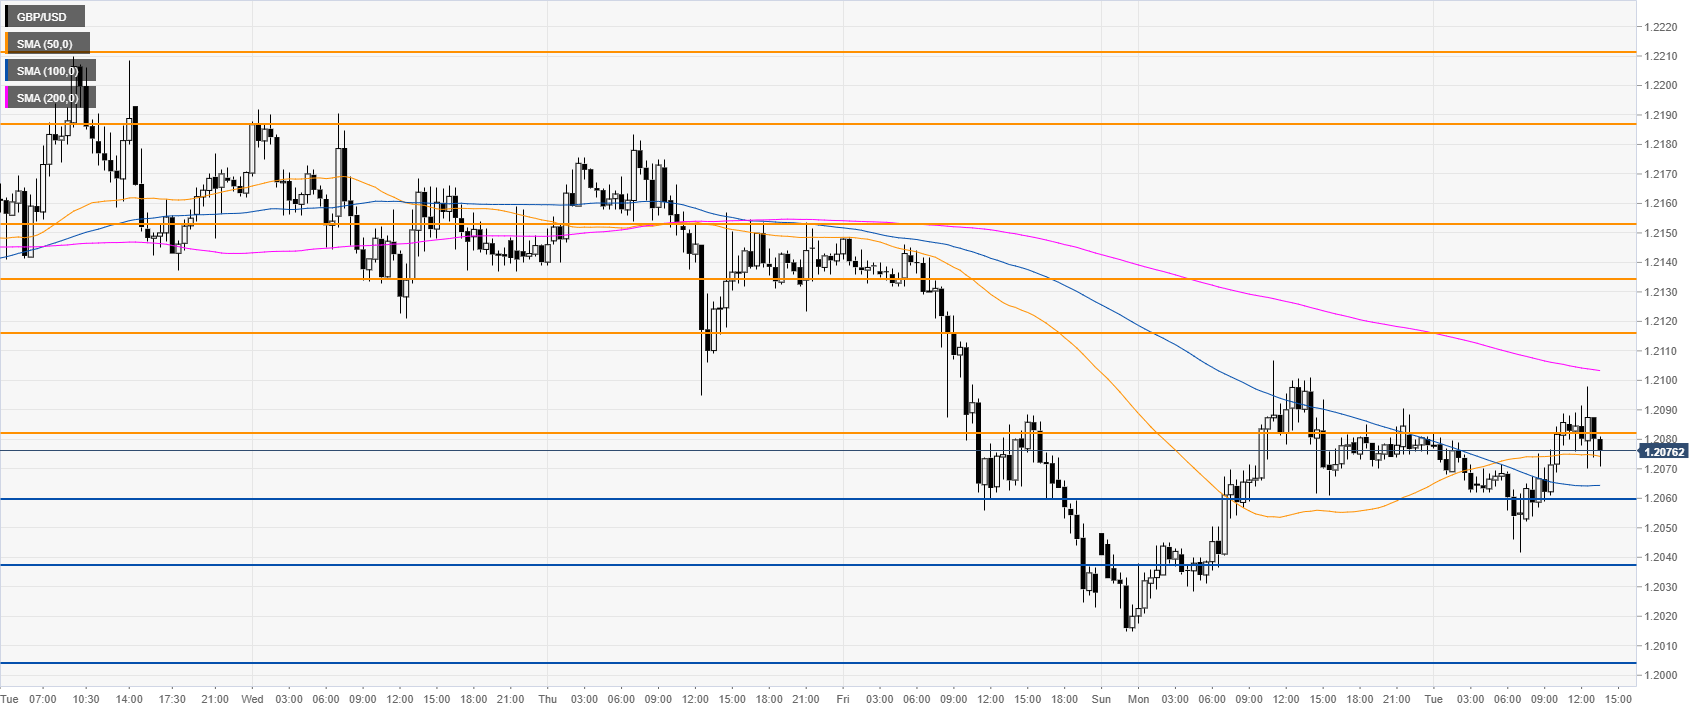
GBP/USD 30-minute chart
Cable is rejecting the current daily high below the 1.2100 figure and the 50 SMA. Bears need to break below 1.2060 and 1.2036 levels to reach 1.2003 on the way down, according to the Technical Confluences Indicator.
Additional key levels
