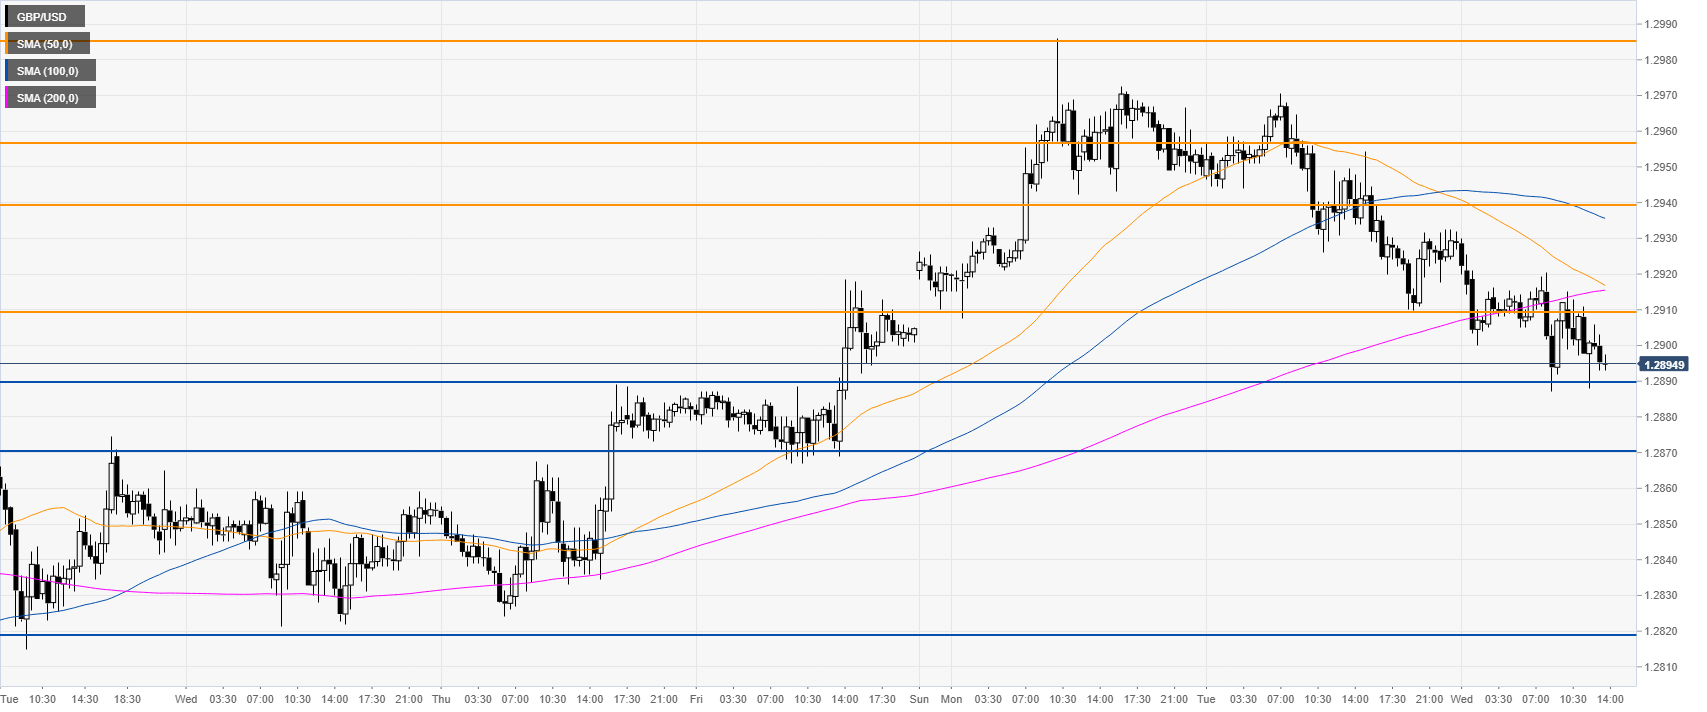
- The cable is trading at its lowest since the start of the week.
- The level to beat for bears is the 1.2890 support.
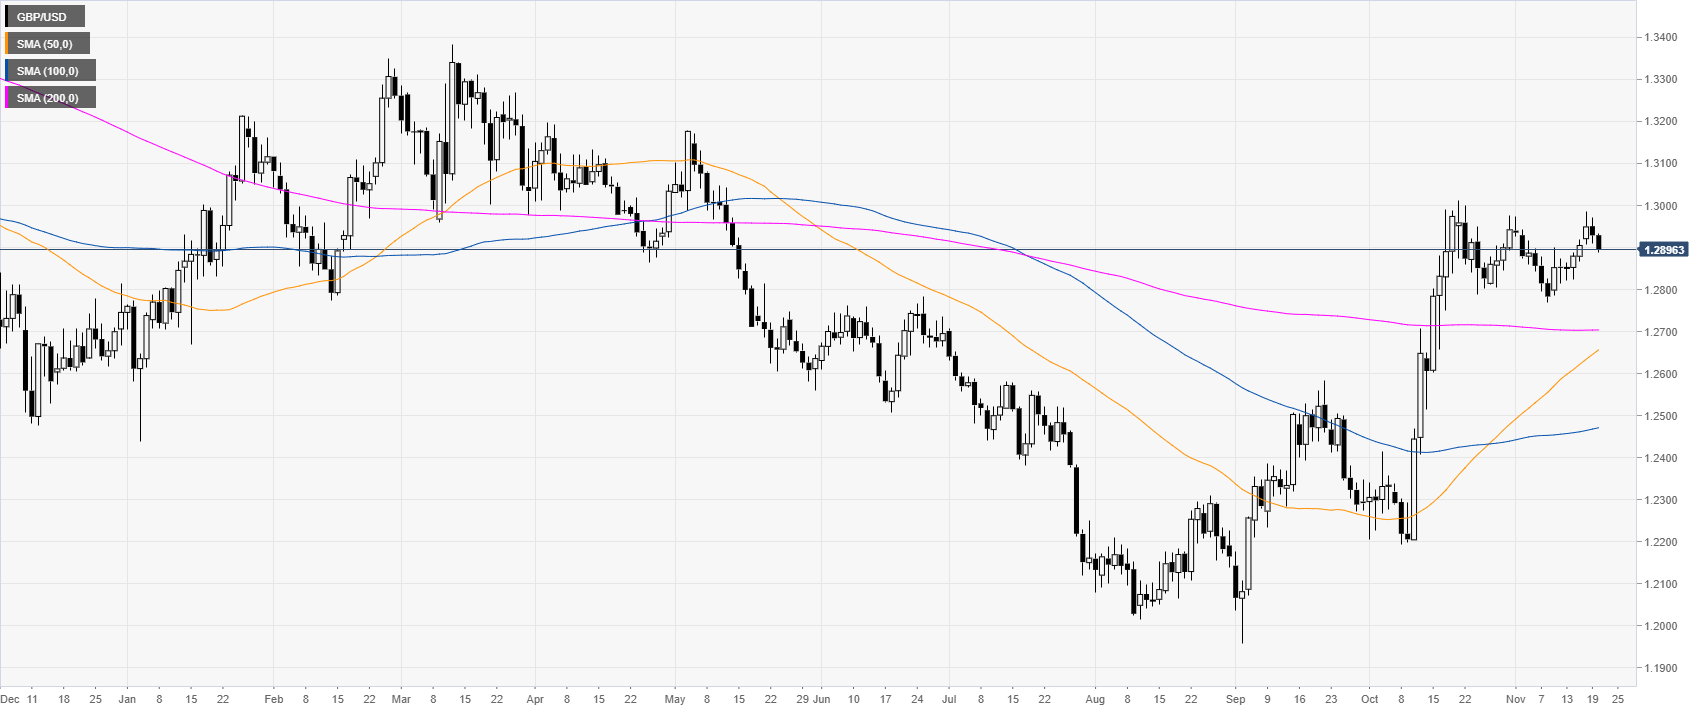
GBP/USD daily chart
The pound is currently consolidating the October’s rally in the 1.2800-1.3000 price zone. GBP/USD, last month, reached levels not seen since mid-May 2019.
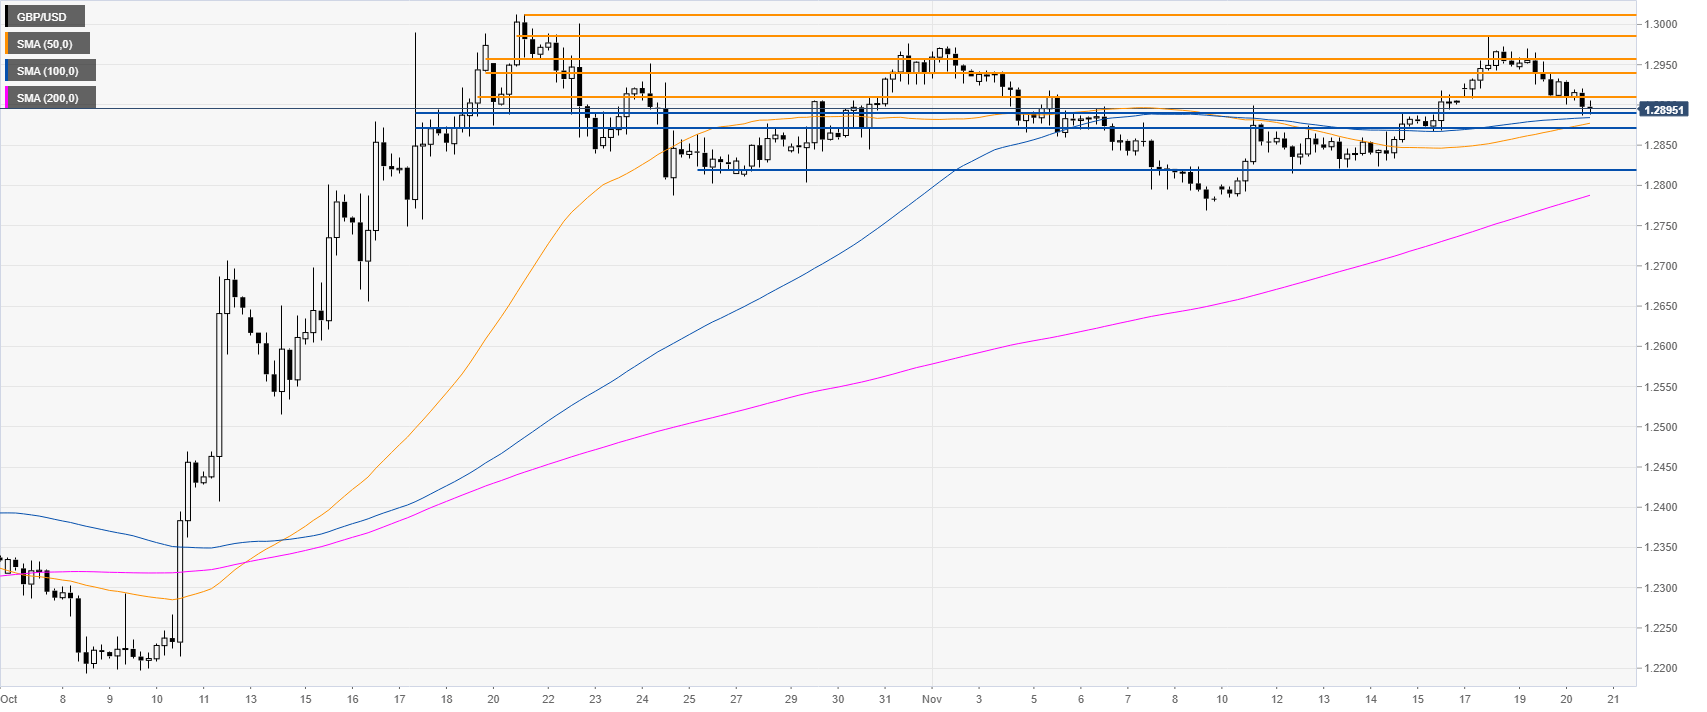
GBP/USD four-hour chart
GBP/USD is drifting down from the monthly highs while challenging the 1.2890 support level. A break below it could lead to an extension of the decline towards the 1.2870 and 1.2820 levels, according to the Technical Confluences Indicator.
GBP/USD 30-minute chart
The market is trading at daily lows below the main SMAs, suggesting a bearish bias in the near term. Resistances are seen at the 1.2910, 1.2940 and 1.2957 price levels.
Additional key levels
