- GBP/USD collapsed to 2-year lows as UK PM Boris Johnson is working on a no-deal Brexit.
- The 1.2216 and 1.2180 level can be the next pit-stop for sellers, according to the Technical Confluences Indicator.
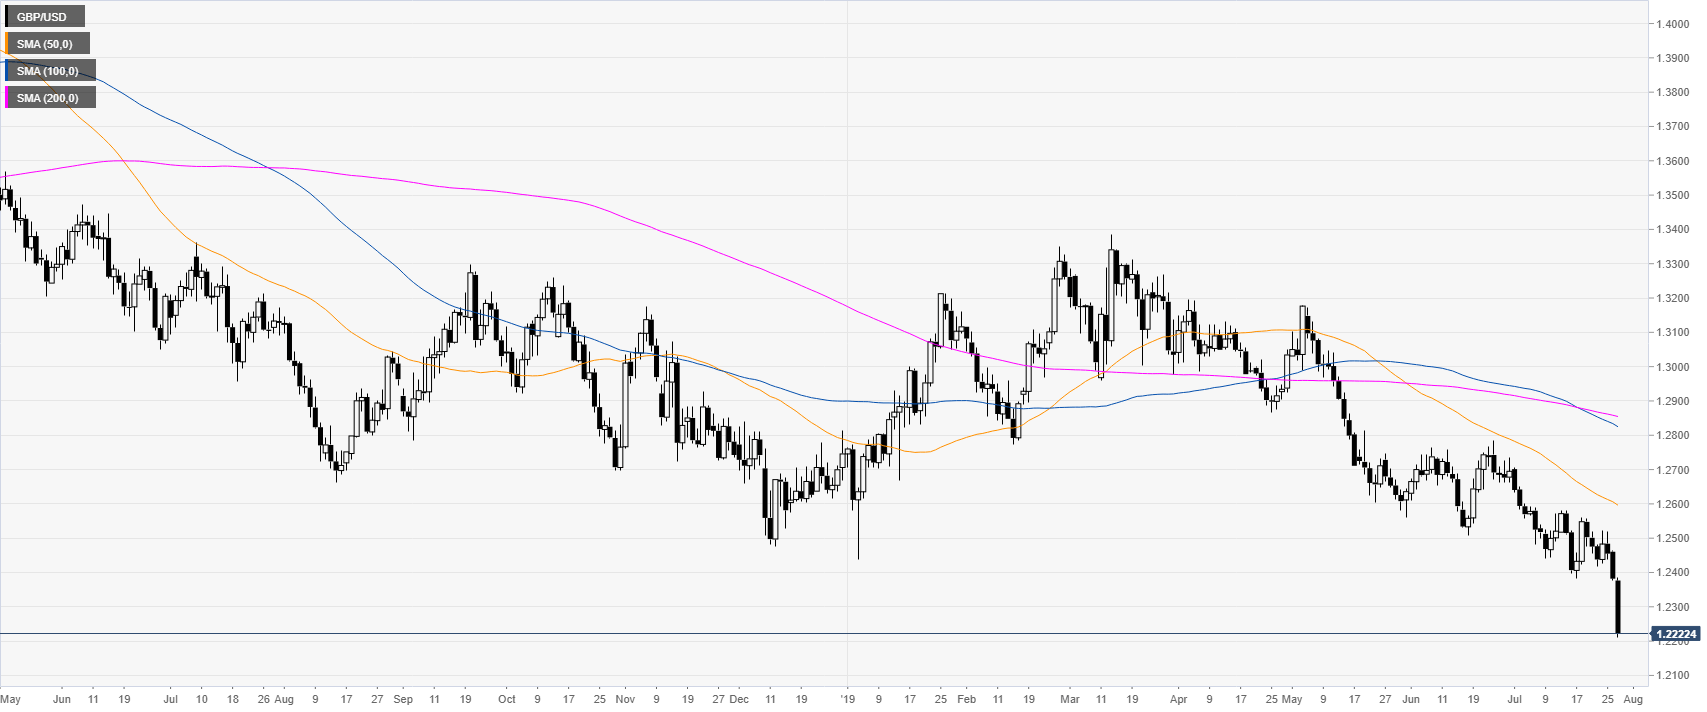
GBP/USD daily chart
Cable down is down to its lowest level since March 2017 as UK Prime Minister Boris Johnson is pushing for a no-deal Brexit.
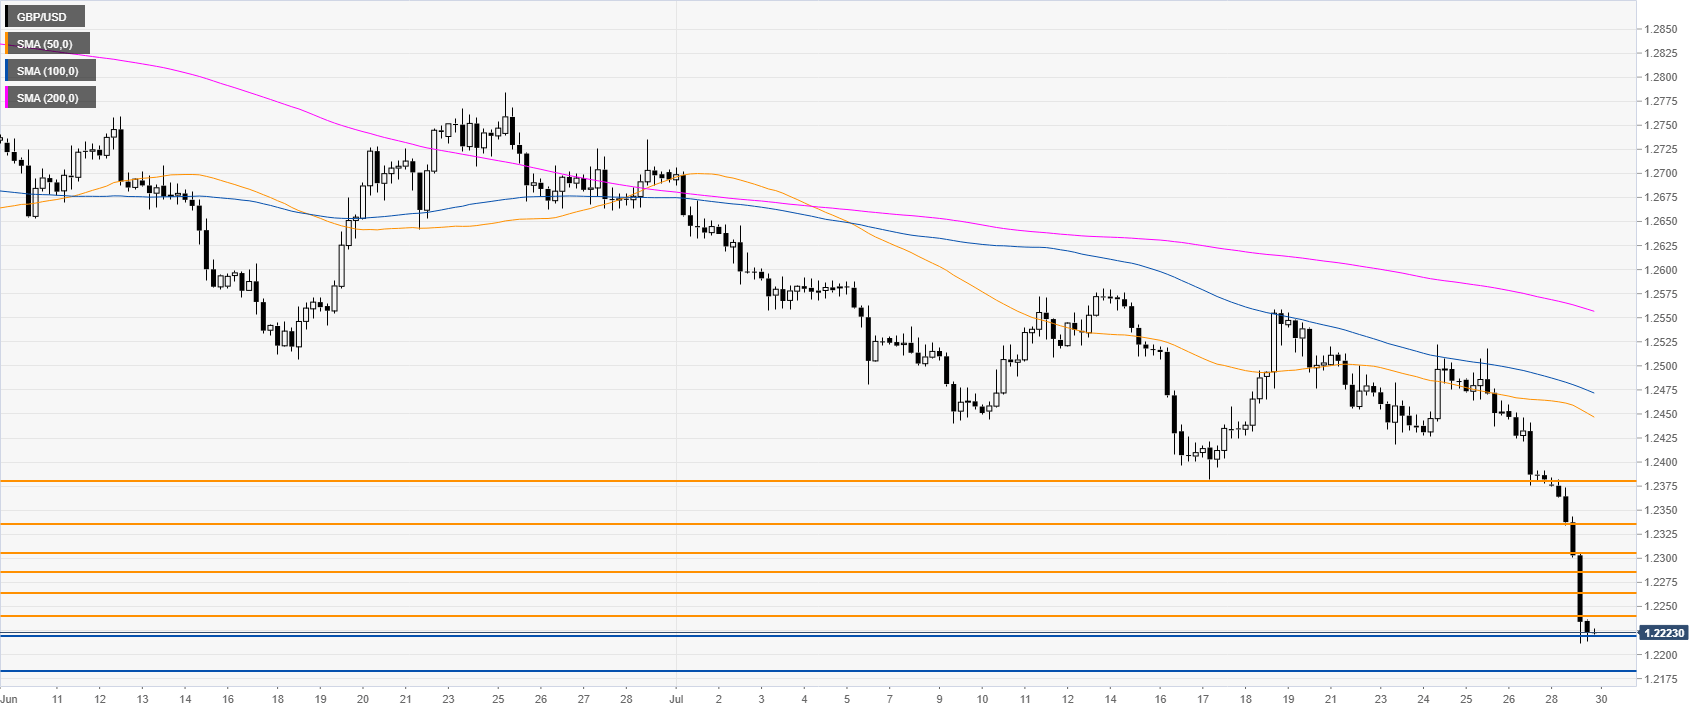
GBP/USD 4-hour chart
GBP/USD is trading below the 1.2240 resistance as the market collapsed this Monday. Bears objective is to continue the move down. A break below 1.2216 can lead to 1.2180 on the way down, according to the Technical Confluences Indicator.
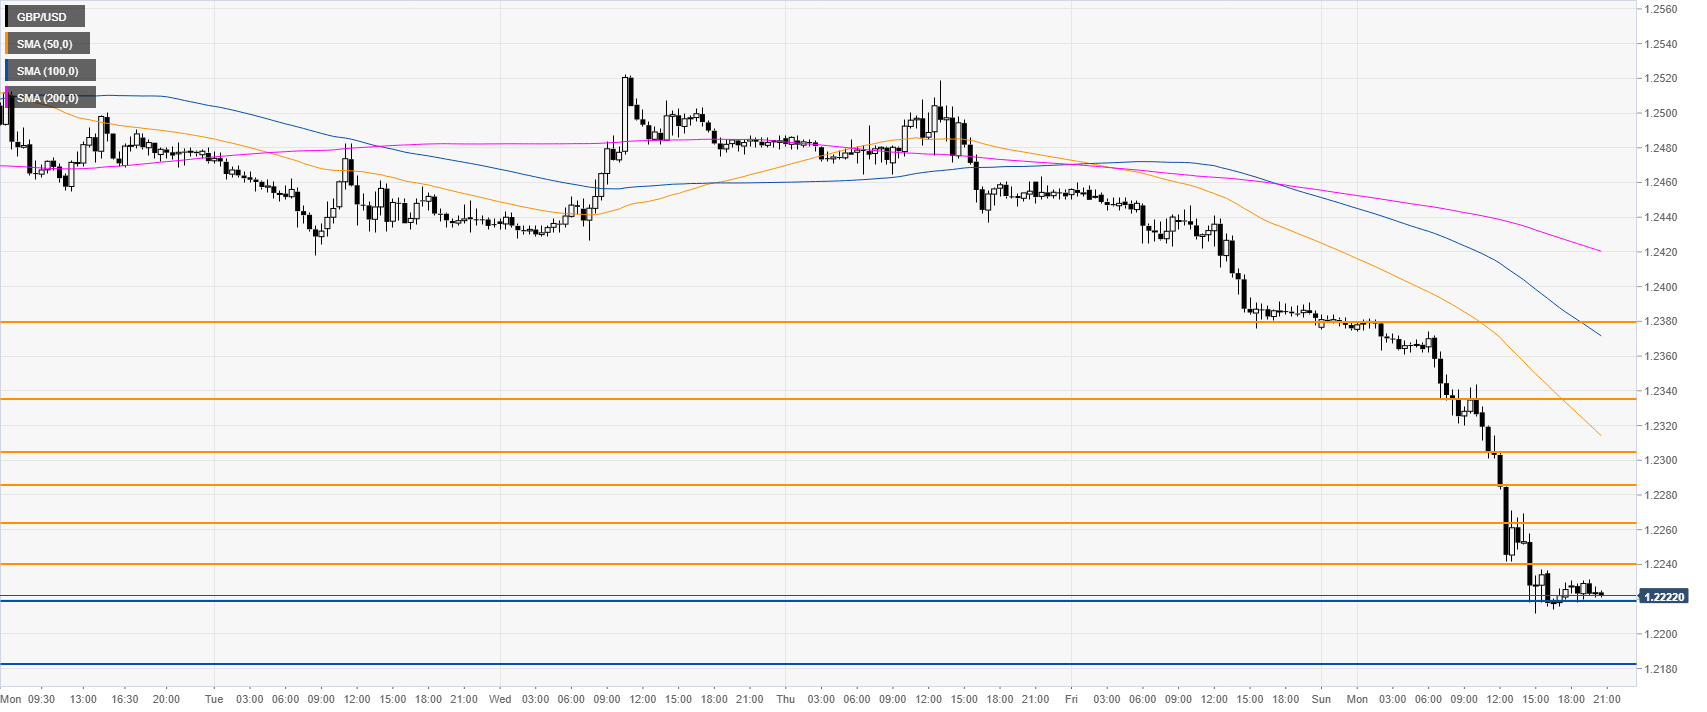
GBP/USD 30-minute chart
Cable is ending the day on its low tick as the sellers have been relentless throughout the day. Resistances are seen near 1.2240, 1.2264, 1.2285, 1.2304, 1.2336 and 1.2381, according to the Technical Confluences Indicator.
Additional key levels
