- GBP/USD tumbled to multi-week lows this Tuesday.
- GBP/USD is under bearish pressure below the 1.2300 handle.
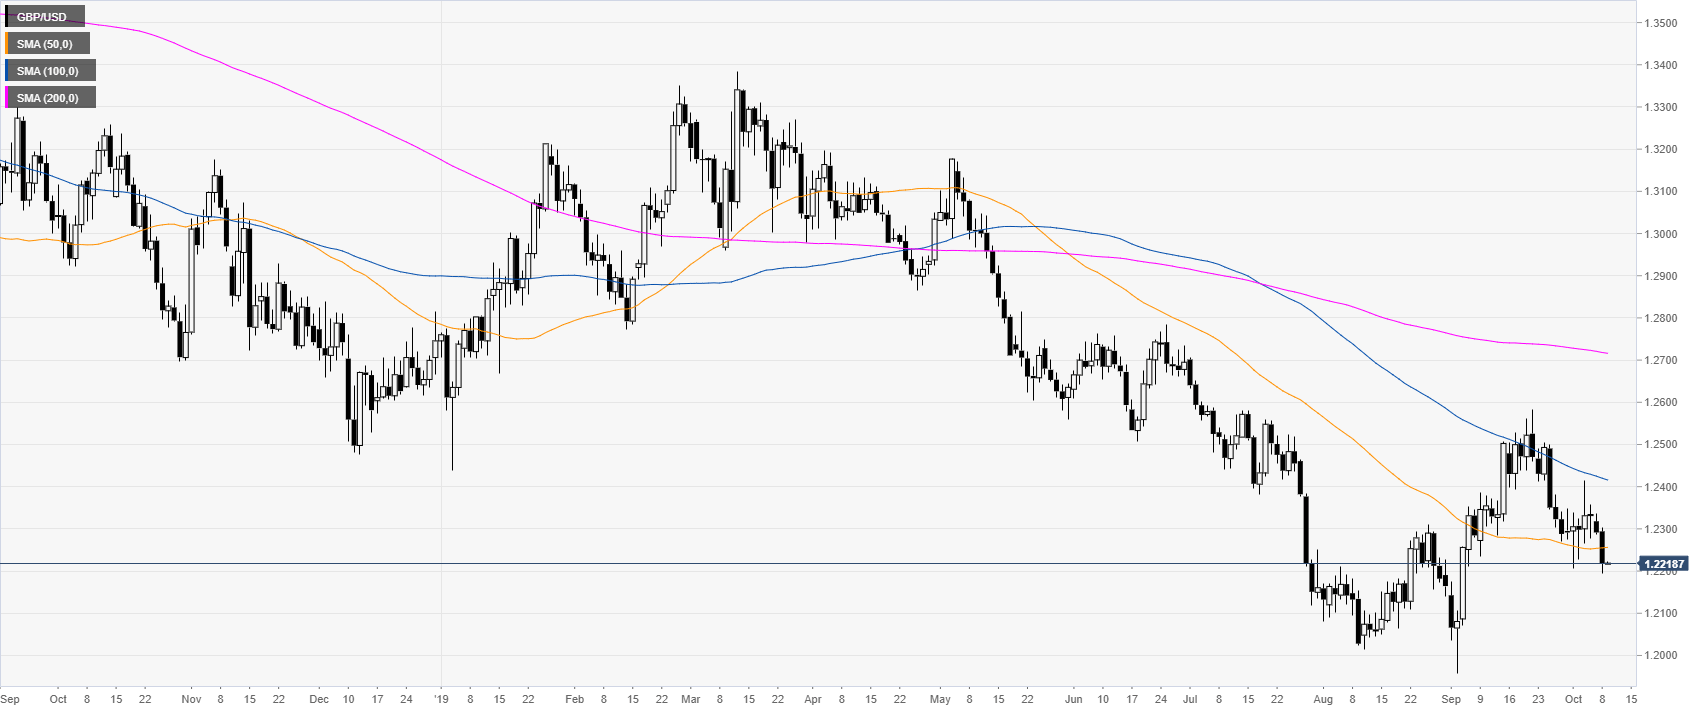
GBP/USD daily chart
On the daily chart, GBP/USD is trading in a bear trend below its main daily simple moving averages (DSMAs). The Sterling is suffering from uncertainties over the Brexit.
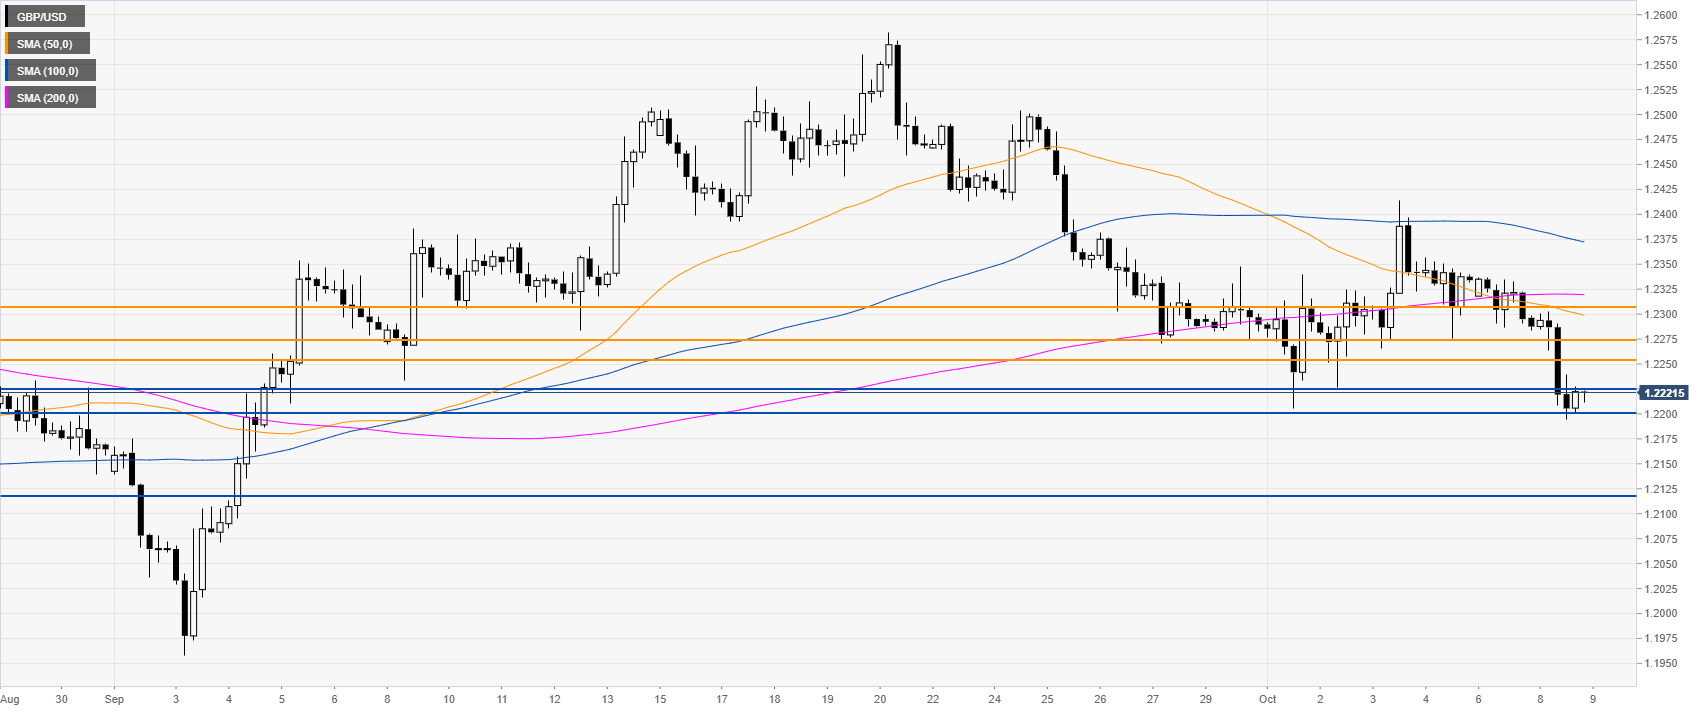
GBP/USD four-hour chart
The Sterling is under bearish pressure below the main SMAs on the four-hour chart. The spot is consolidating the recent losses near the 1.2224/20 support zone. A bear break below this level would expose the Cable to further losses towards the 1.2114 price level, according to the Technical Confluences Indicator.
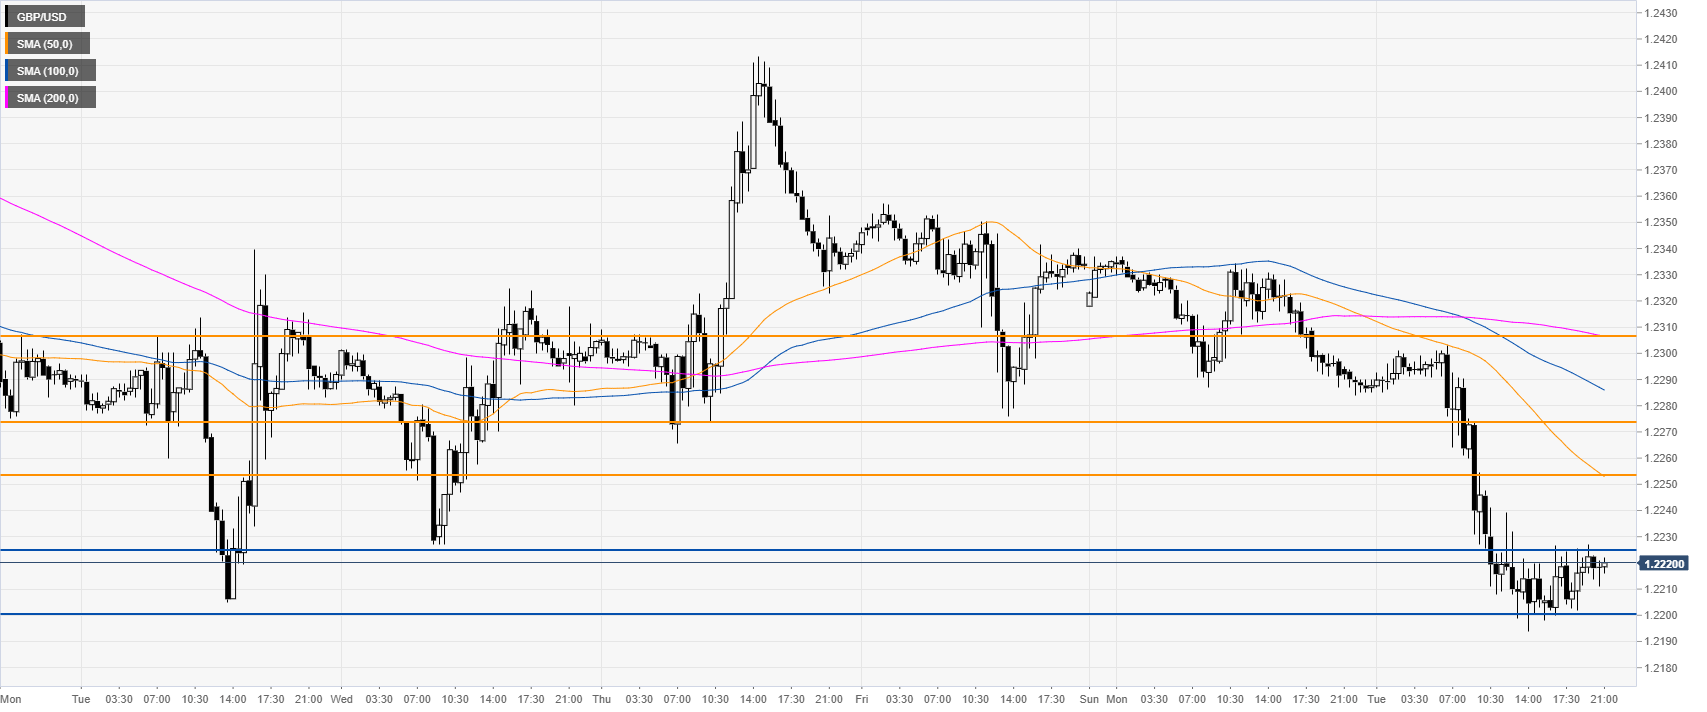
GBP/USD 30-minute
The Sterling is trading below its main SMAs, suggesting a bearish bias in the short term. Immediate resistances are seen at 1.2253, 1.2276 and 1.2305 price levels, according to the Technical Confluences Indicator.
Additional key levels
