- GBP/USD ends Monday near its daily lows below the 1.2300 handle.
- The level to beat for sellers is the 1.2275 support.
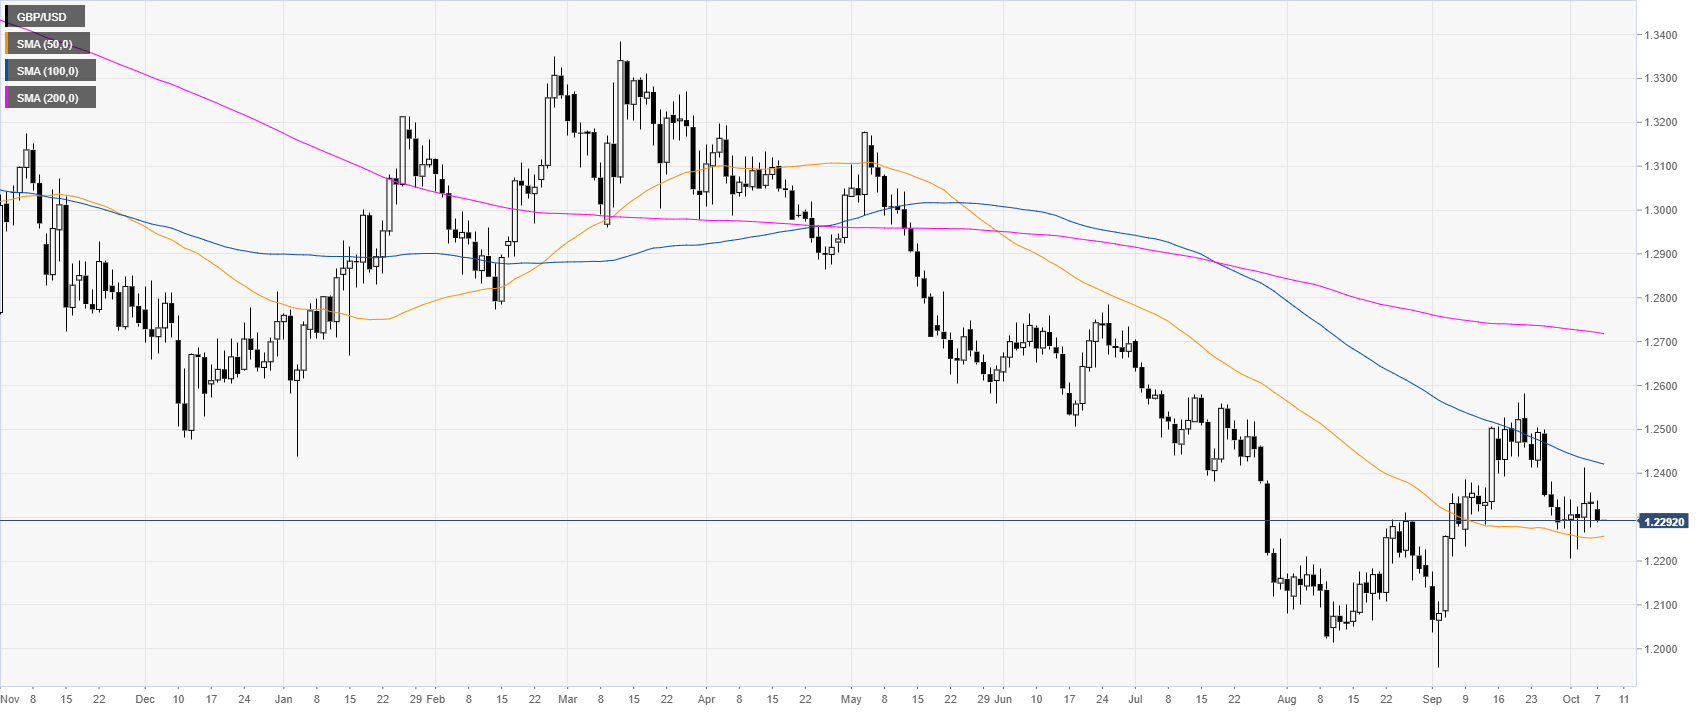
GBP/USD daily chart
On the daily chart, the Pound is trading in a bear trend below its 100 and 200-day simple moving averages (DSMAs). The market remains trapped between the 50 SMA at 1.2254 and the 1.2400 figure as the European Union rejected the latest UK PM’s Johnson proposal.
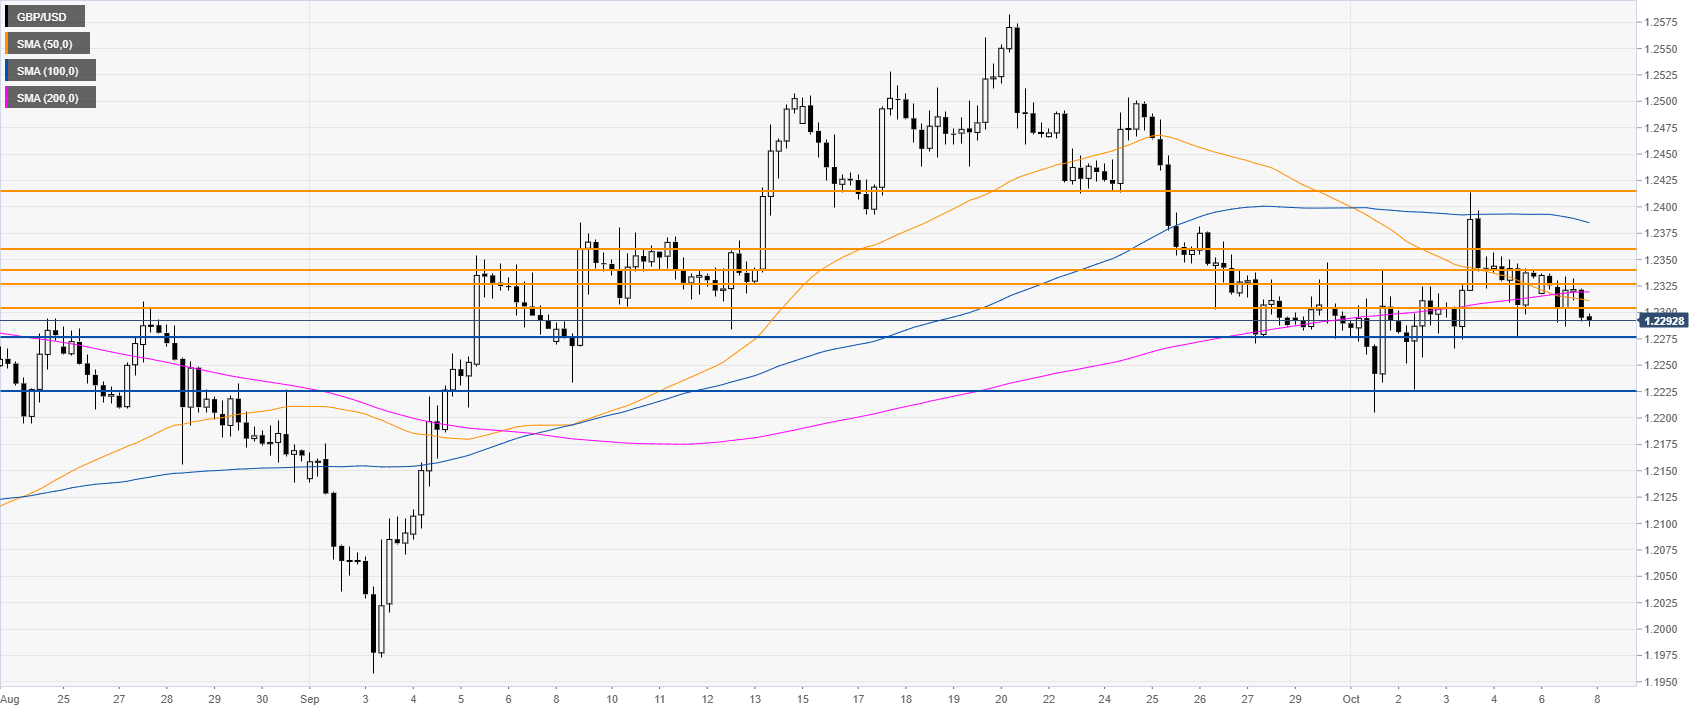
GBP/USD four-hour chart
GBP/USD is trading below its main SMAs on the four-hour chart, suggesting bearish momentum in the medium term. The spot needs a breakdown below the 1.2305/1.2275 support zone to drive the market towards 1.2224 support level, according to the Technical Confluences Indicator.
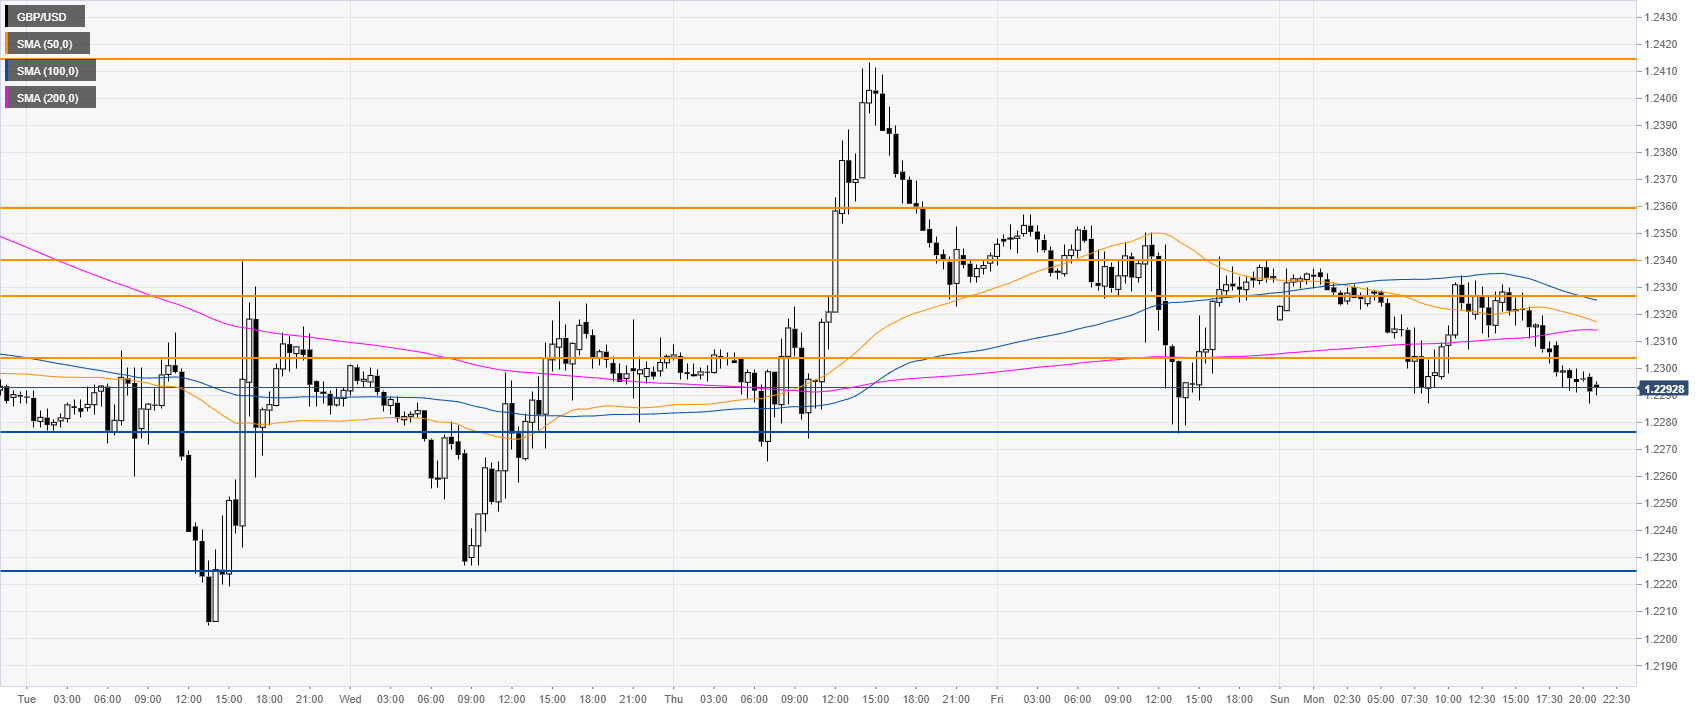
GBP/USD 30-minute
The Sterling is trading within familiar ranges and below its main SMAs, suggesting bearish momentum in the short term. Immediate resistances are seen at 1.2305, 1.2326 and the 1.2340/60 price levels. Further up lie 1.2412 resistance, according to the Technical Confluences Indicator.
Additional key levels
