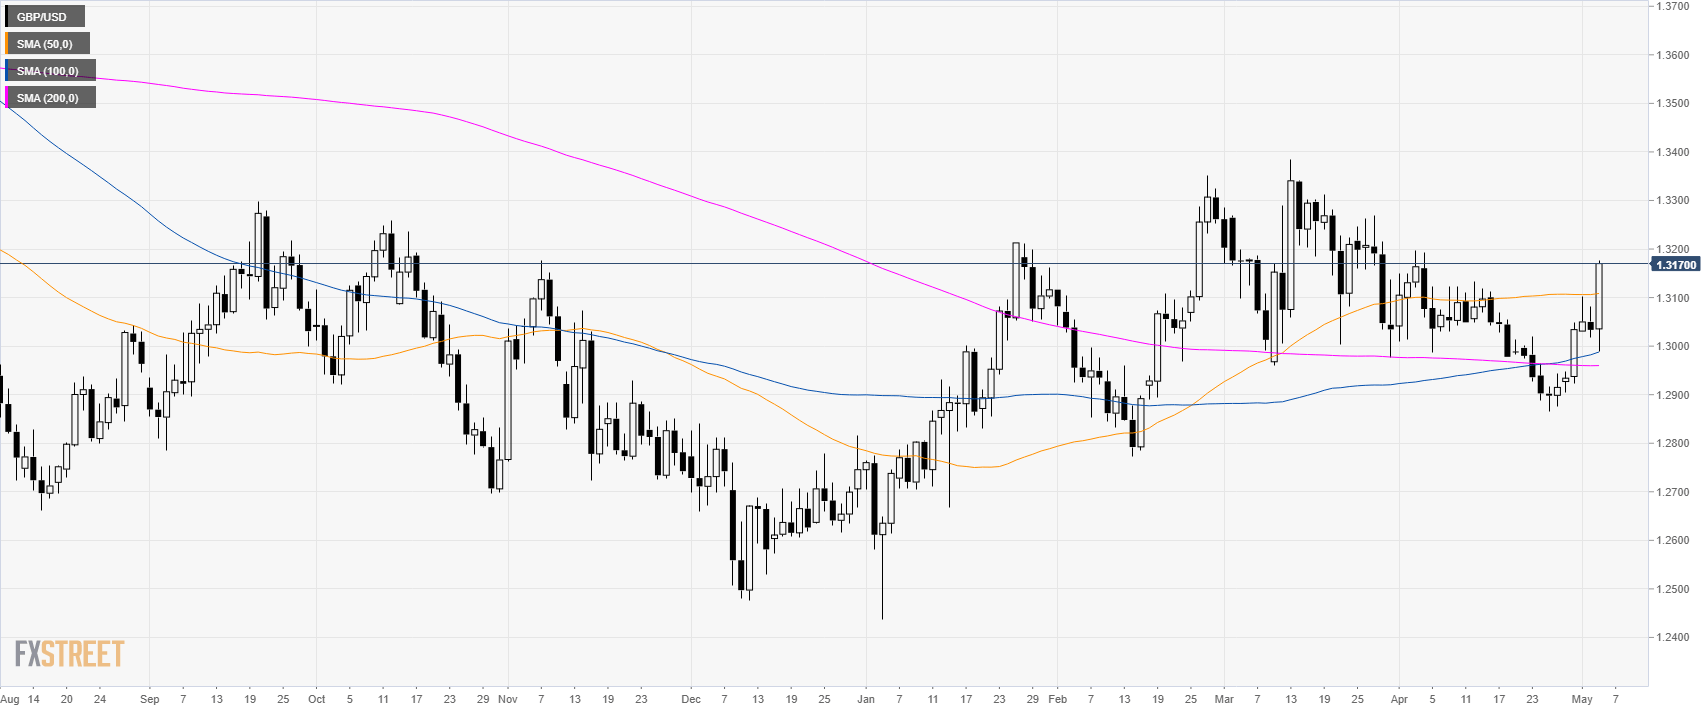
GBP/USD daily chart
- GBP/USD is nearing the 1.3200 figure as the market is trading above its main simple moving averages (SMAs).
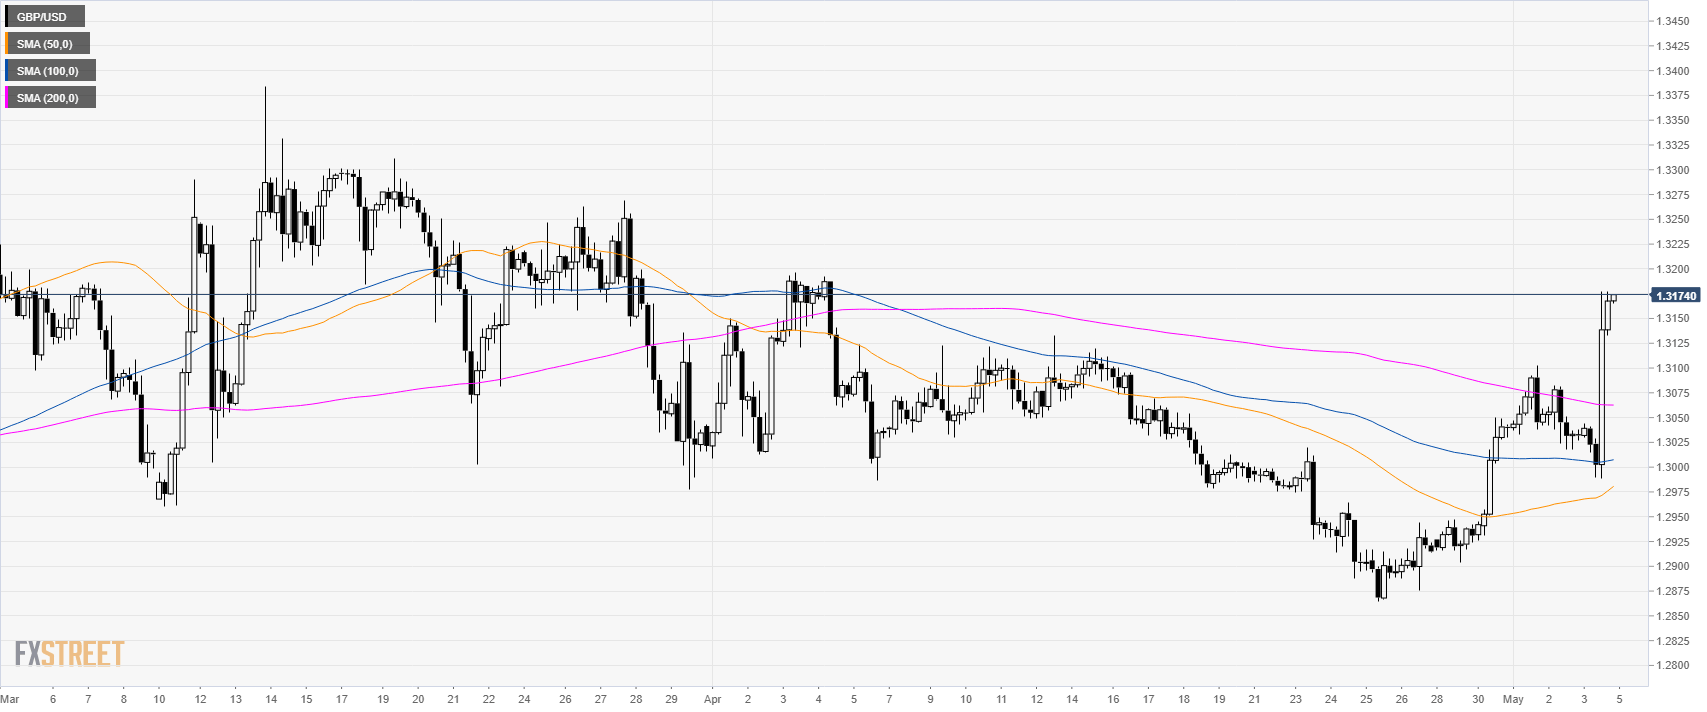
GBP/USD 4-hour chart
- GBP/USD is trading above its main SMAs suggesting bullish momentum in the medium-term.
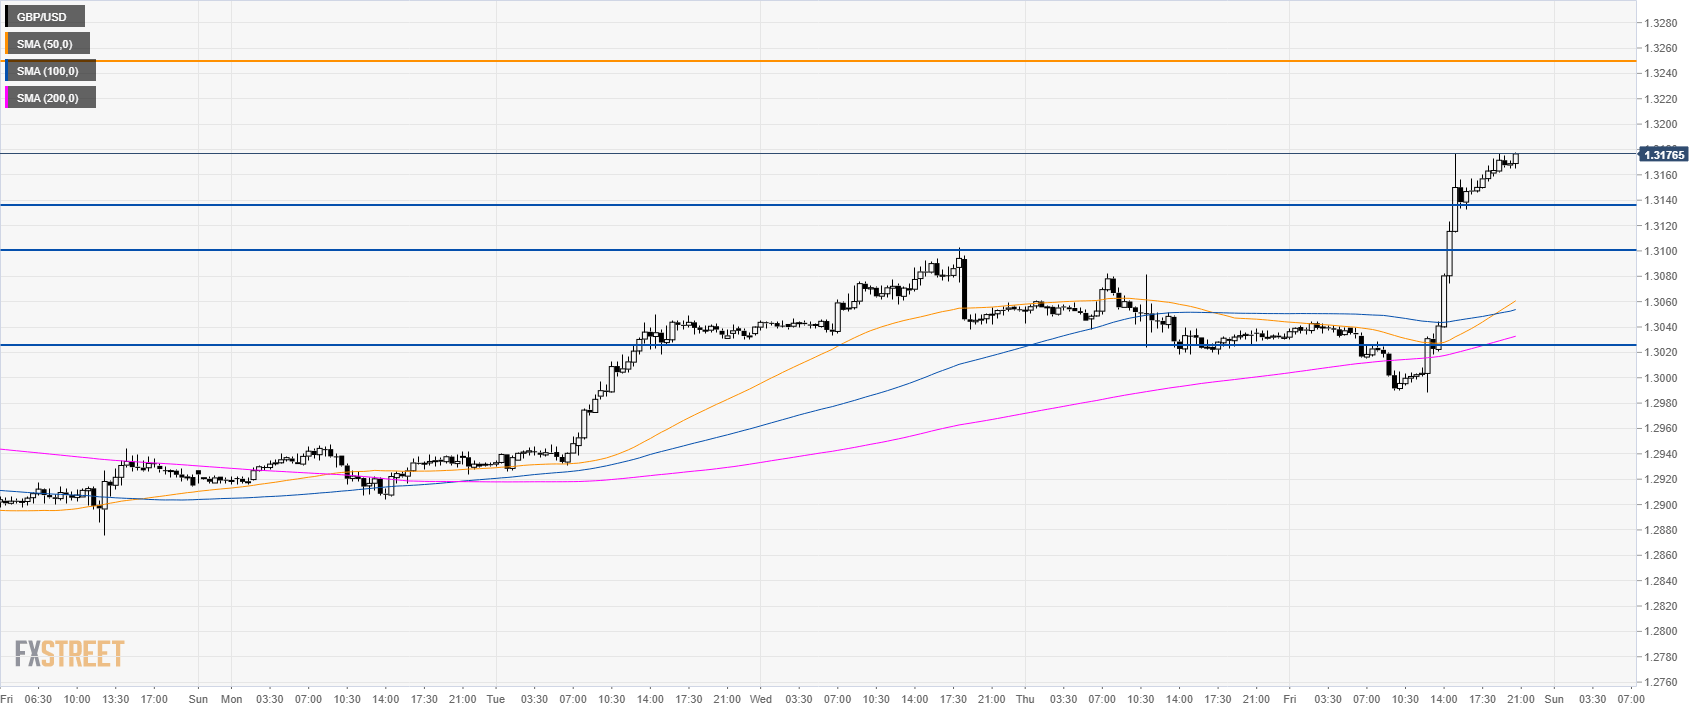
GBP/USD 30-minute chart
- GBP/USD is trading above its main SMA suggesting bullish momentum in the short-term.
- The strength is likely going to continue next week with 1.3250 and 1.3350 as main bull targets.
- Support is seen at 1.3140, 1.3100 and 1.3025 level.
Additional key levels
