- GBP/USD is up about 120 pips this Friday as the market sold USD on the back of comments from US President Trump criticizing the Federal Reserve Bank to be in a hiking cycle.
- The momentum has momentarily shifted to bullish giving a break to the protracted bear trend of the last weeks. Indeed, the 50 and 100-period simple moving averages have crossed above the 200-period SMA.
- The next resistances to the upside are seen near 1.3155 and the 1.3200 figure while supports are likely located near 1.3100 figure and 1.3049 June 28 low.
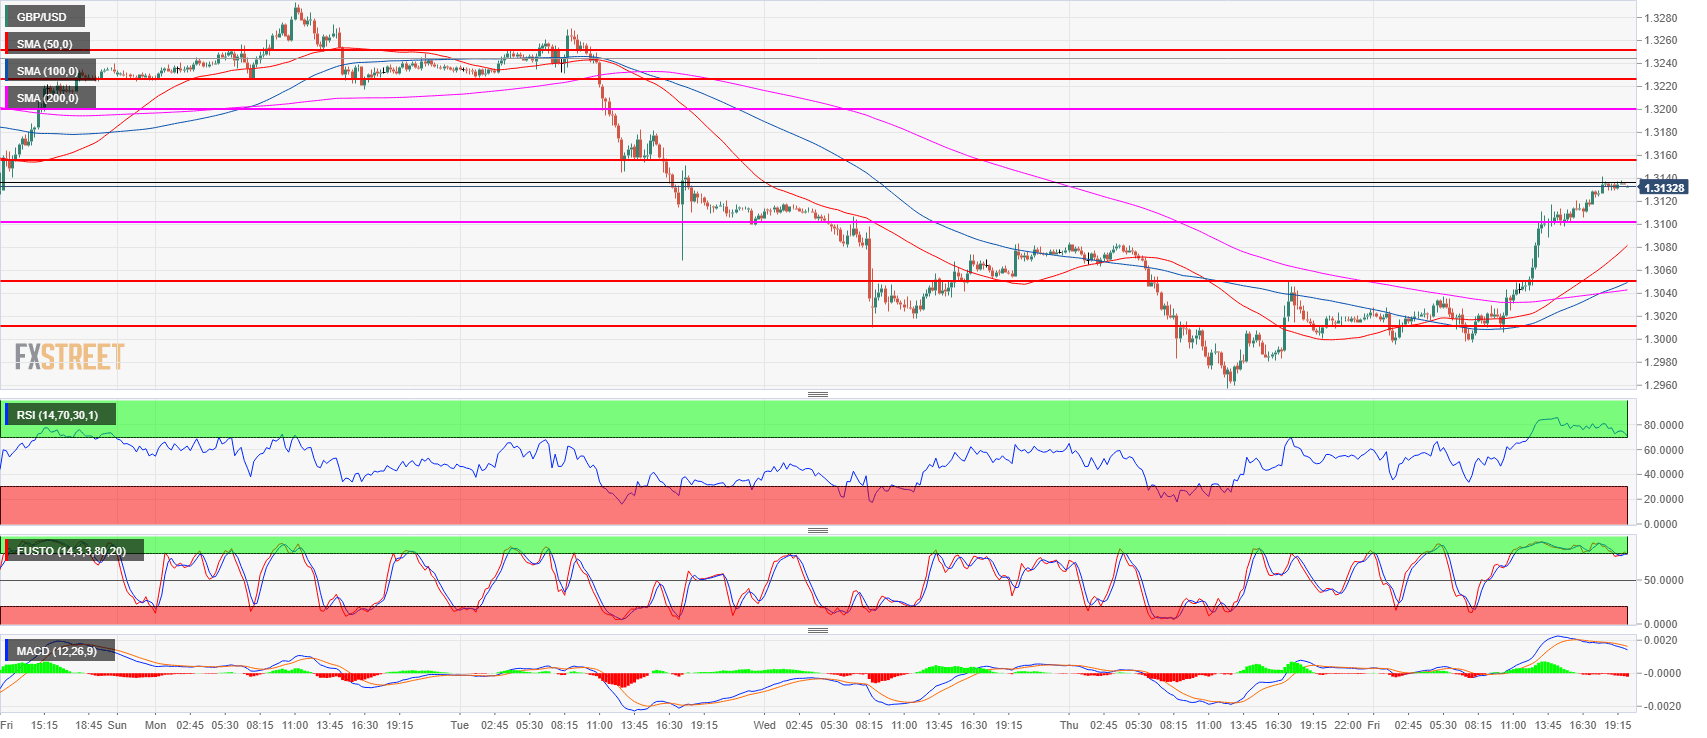
Spot rate: 1.3133
Relative change: 0.90%
High: 1.3141
Low: 1.2995
Trend: Bearish / Bullish correction
Resistance 1: 1.3155 former breakout point
Resistance 2: 1.3200 figure
Resistance 3: 1.3250 June 4 high
Support 1: 1.3100 figure
Support 2: 1.3049 June 28 low
Support 3: 1.3010 July 18 low
Support 4: 1.2957 current 2018 low
Support 5: 1.2908 September 5, 2017 low
Support 6: 1.2774 August 24, 2017 low
