- GBP/USD got a 40-pip knee-jerk reaction to the upside after the release of the US Consumer Price Index (CPI) which came in line with analyst expectations at 2.3% in June.
- GBP/USD is facing some resistance at 1.3250 and at the 200-period simple moving average as the bulls are trying to create a bull breakout in order to reclaim the 1.3300 figure.
- GBP/USD is currently retracing to the downside the US CPI news boost as the USD Dollar is slowly regaining strength. Bears need a breakout below 1.3200 while bulls need a breakout above 1.3300 in order to further confirm the directionality of the pair.
GBP/USD 15-minute chart
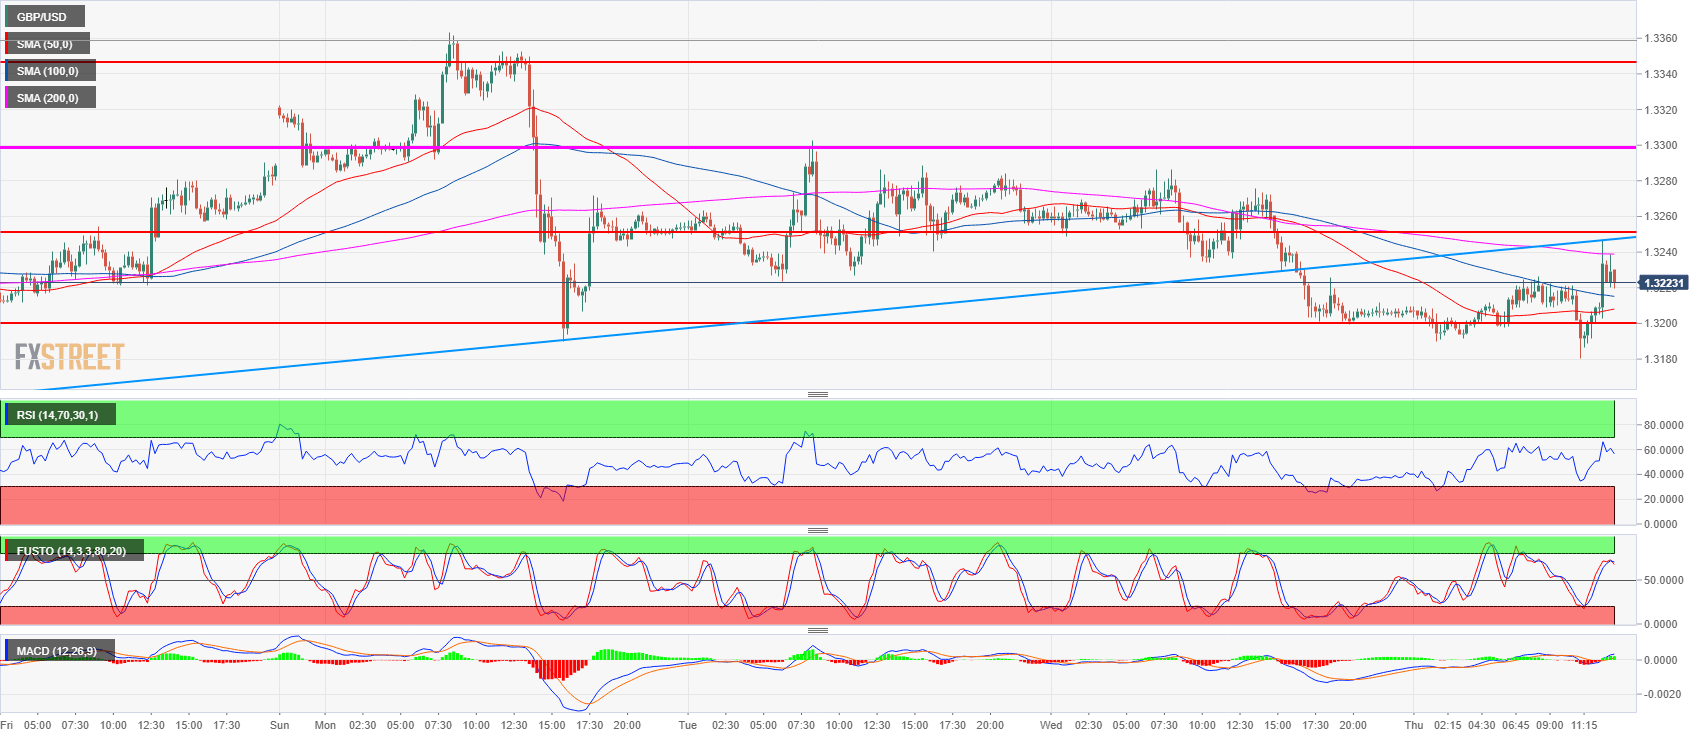
Spot rate: 1.3223
Relative change: 0.12%
High: 1.3246
Low: 1.3180
Trend: Neutral to bearish
Resistance 1: 1.3250 June 4 high
Resistance 2: 1.3300 figure
Resistance 3: 1.3363 weekly high
Resistance 4: 1.3400 figure
Resistance 5: 1.3472 June’s high
Support 1: 1.3200 figure
Support 2: 1.3155 former breakout point
Support 3: 1.3100 figure
Support 4: 1.3049 current 2018 low
Support 5: 1.3027 October 6, 2017 swing low
