- GBP/USD soars 200 pips as Irish PM Varadkar believes it’s possible to reach a deal before October 31st.
- GBP/USD is challenging the 1.2400 handle while spanning the entire October range.
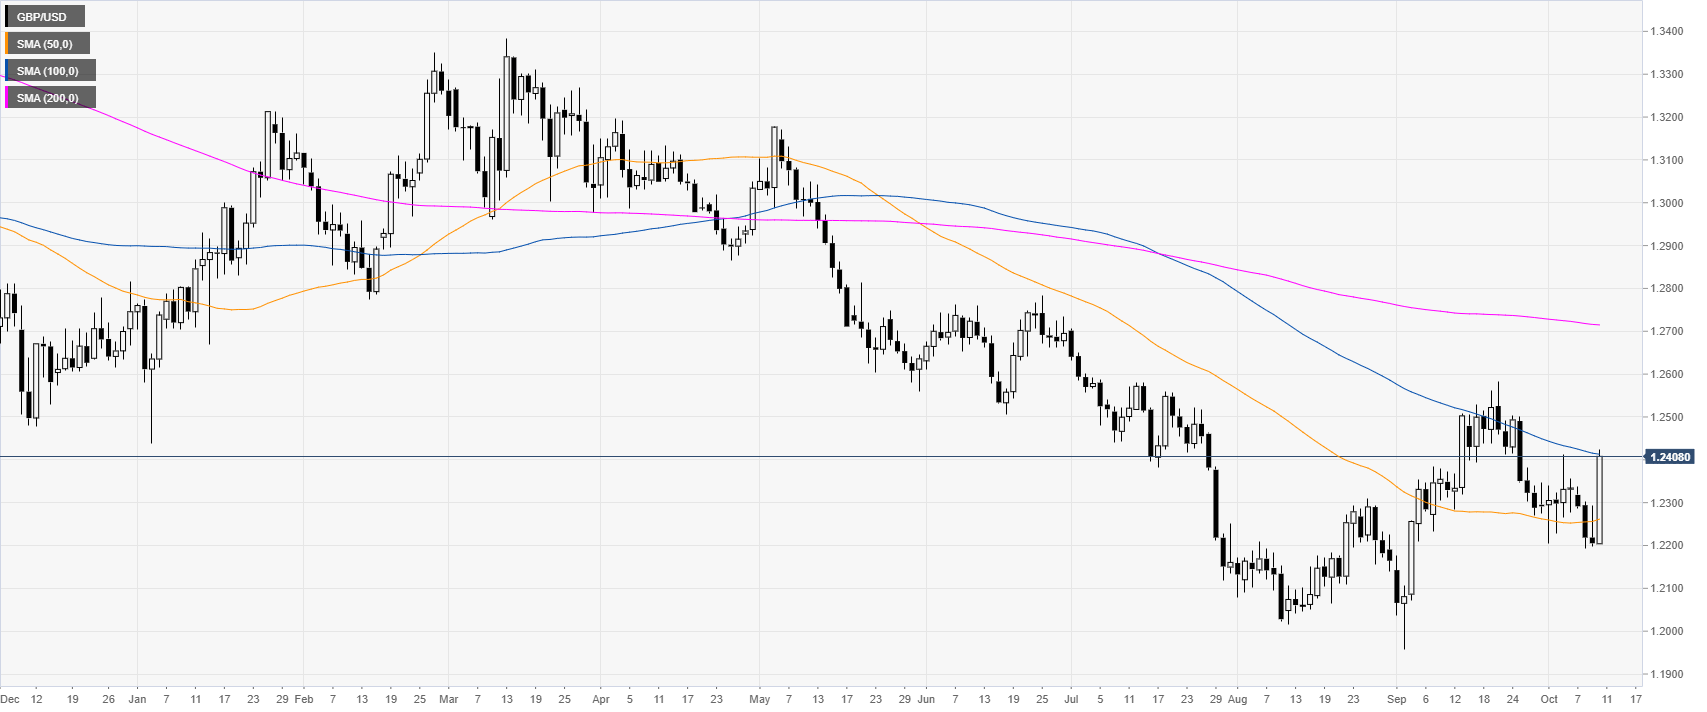
GBP/USD daily chart
On the daily chart, the Cable is trading in a bear trend below the 200-day simple moving average (DSMA). GBP/USD is on fire as Irish PM Varadkar believes it’s possible to reach a deal before October 31st.
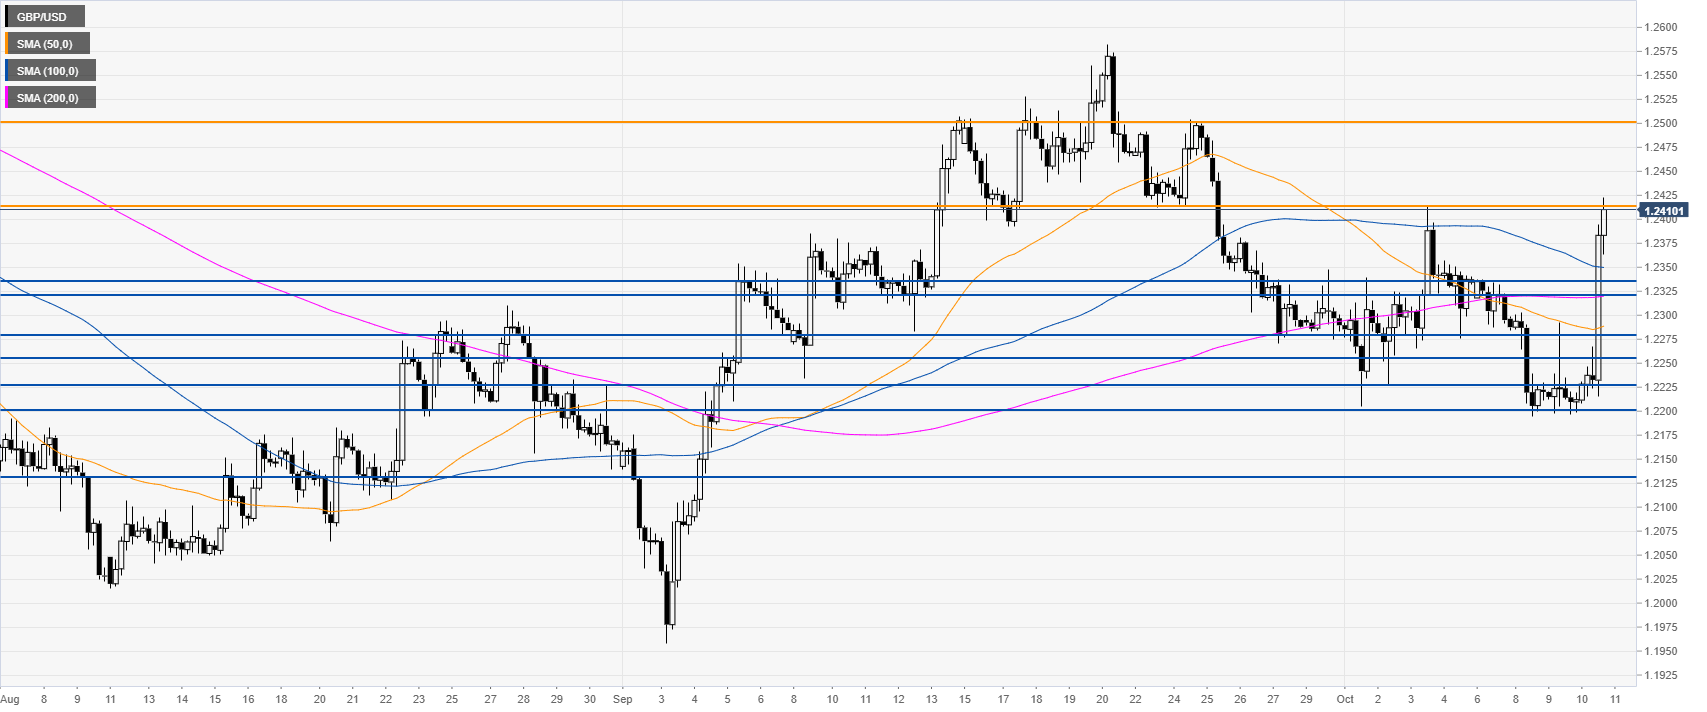
GBP/USD four-hour chart
GBP/USD is challenging the 1.2400 handle as GBP/USD spanned its entire current monthly range. A daily close above the current resistance at 1.2400 can lead to further strength towards the 1.2500 figure.
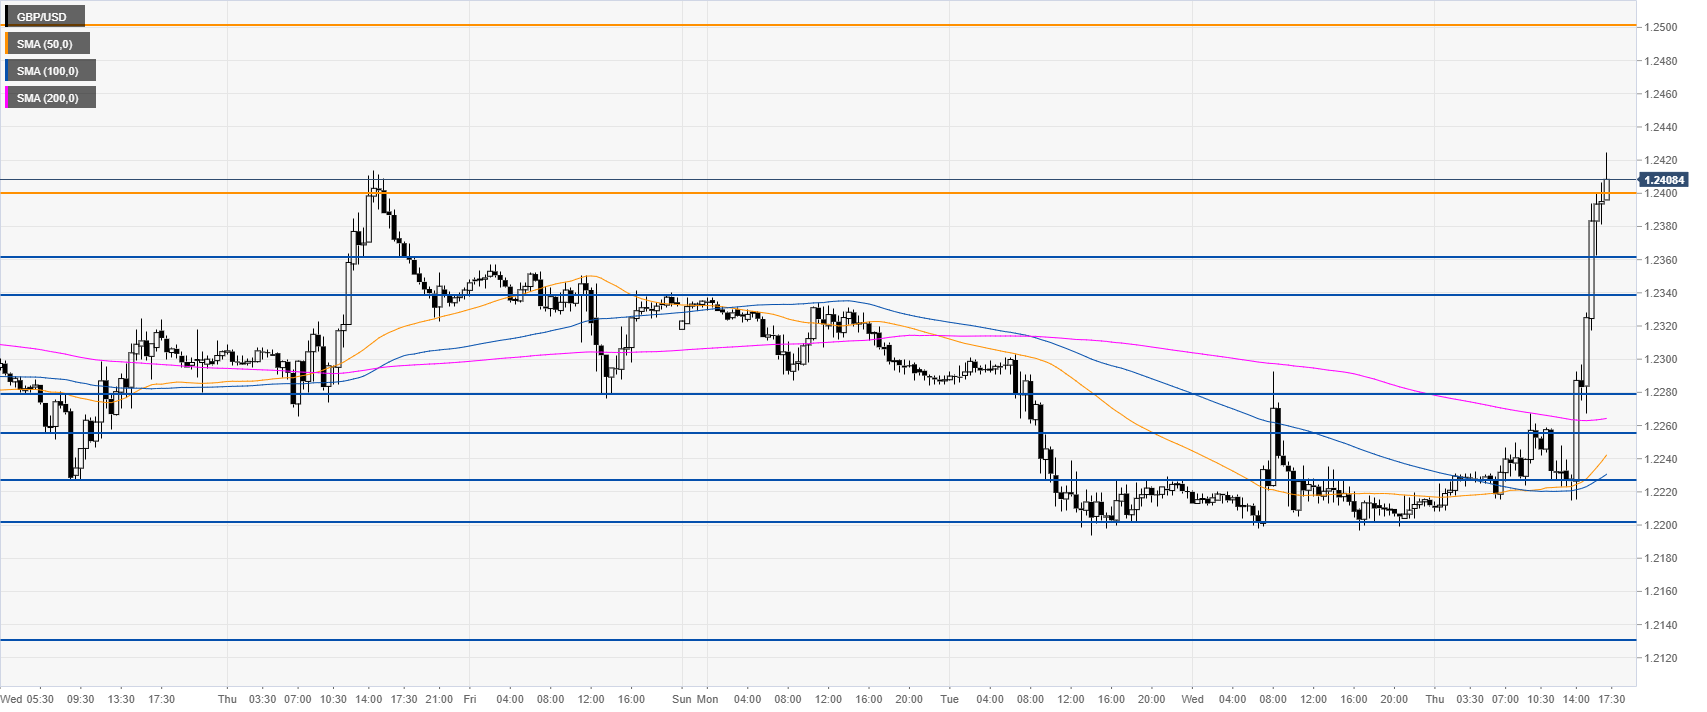
GBP/USD 30-minute chart
The Sterling is trading above the main SMAs, suggesting bullish momentum in the near term. Support is seen at the 1.2360 and 1.2340 price levels.
Additional key levels
