- The Sterling cheers shrinking chances of a no-deal Brexit.
- GBP/USD is also supported by broad-based USD weakness.
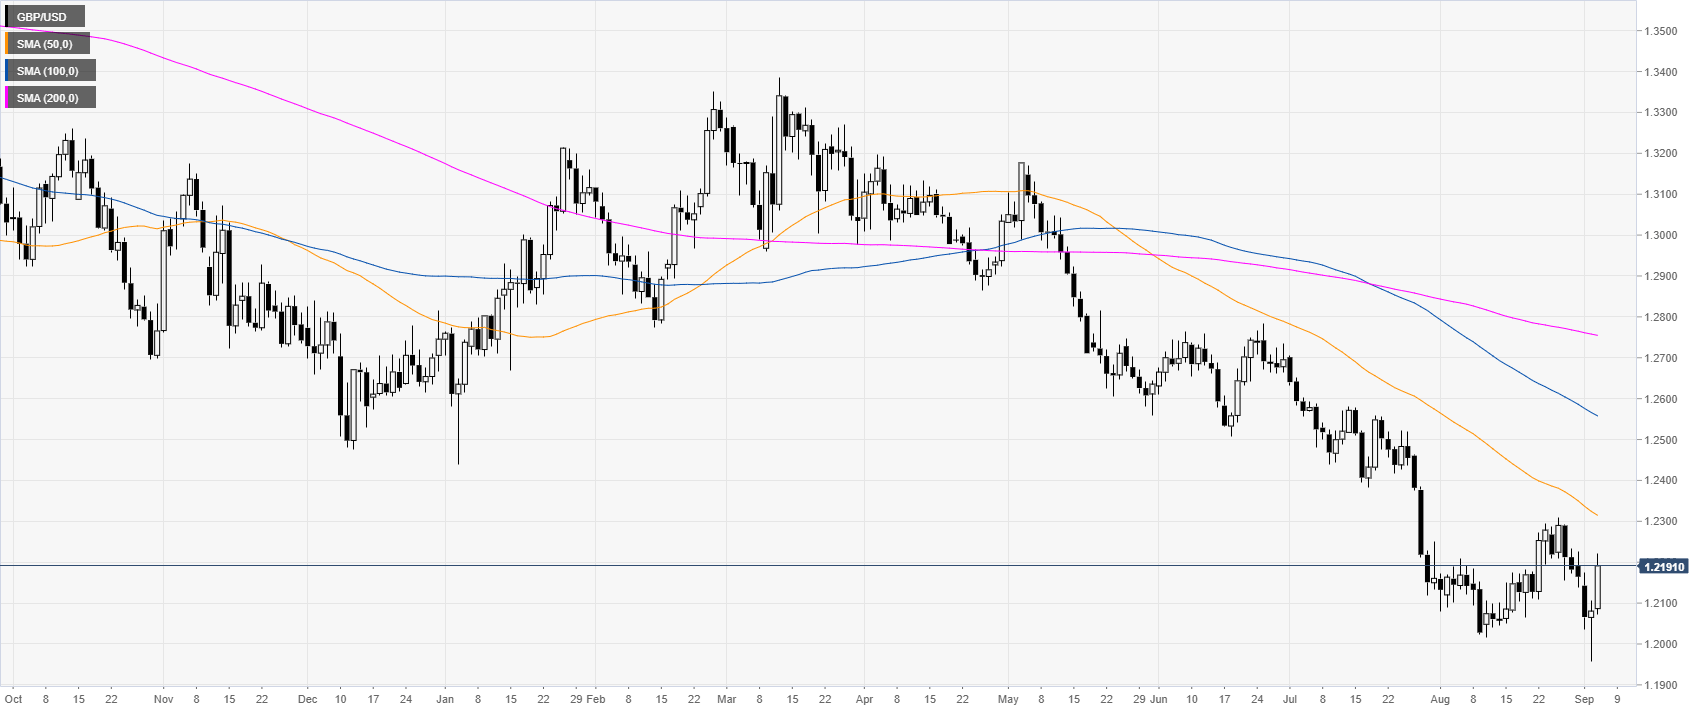
GBP/USD daily chart
The GBP/USD exchange rate is trading in a bear trend below the main daily simple moving averages (SMAs). The market is rebounding sharply from multi-year lows as chances of a no-deal Brexit are shrinking and USD weakness.
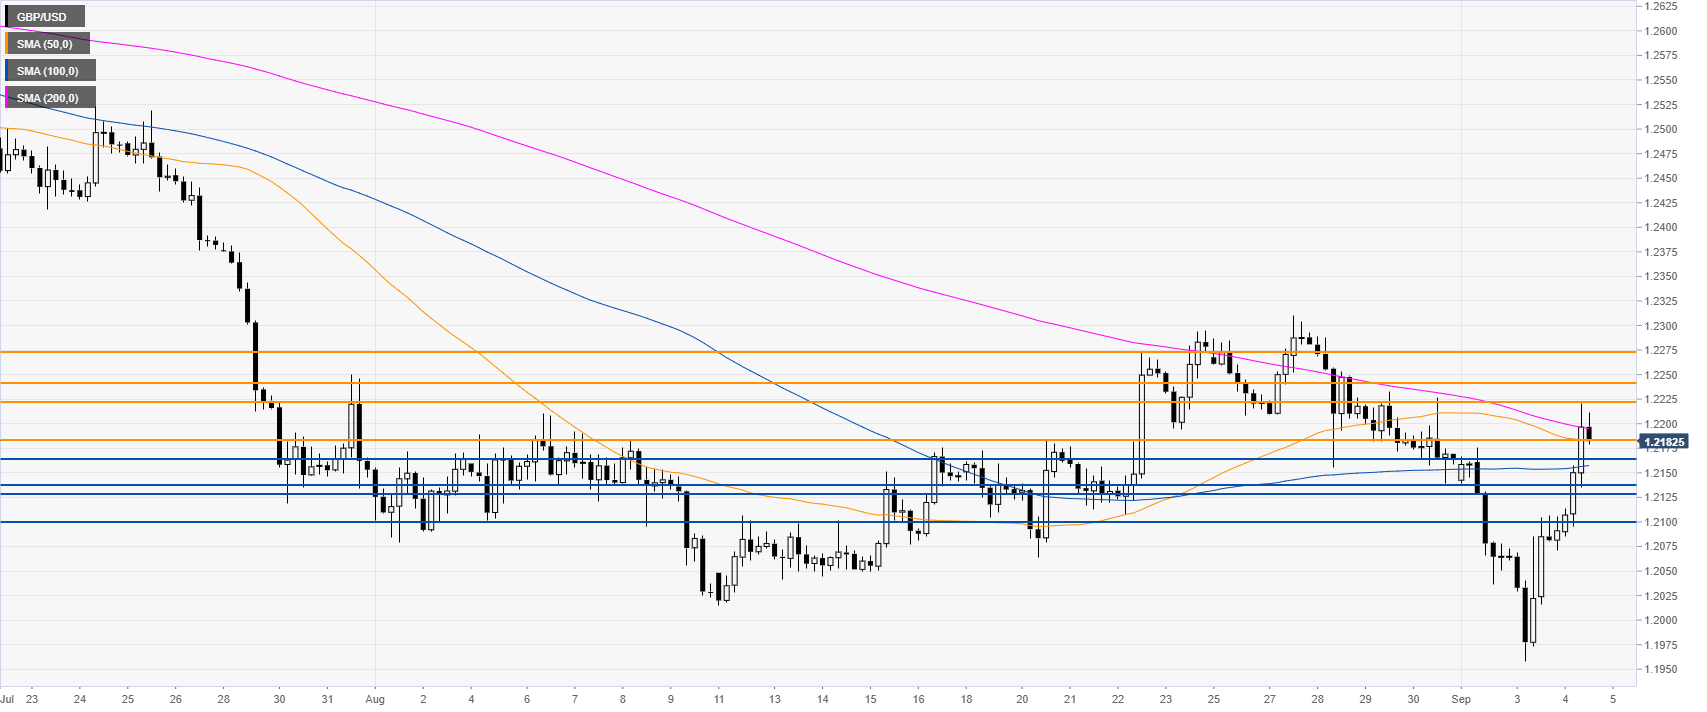
GBP/USD 4-hour chart
GBP/USD is challenging the 1.2185 level and the 50/200 SMAs. To continue the recovery, buyers need to overcome the 1.2223 resistance to reach 1.2243 and 1.2274 levels on the way up, according to the Technical Confluences Indicator.
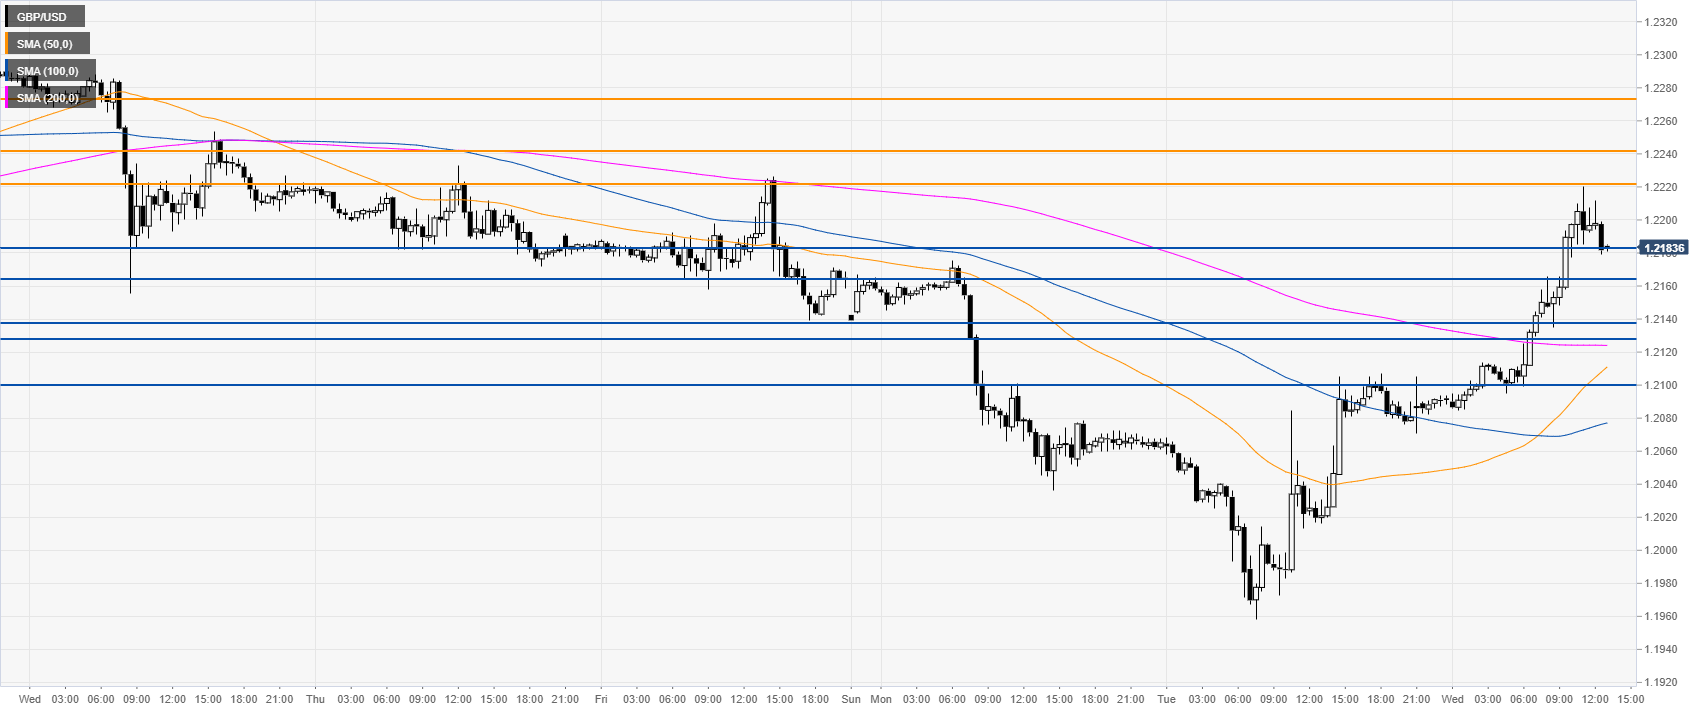
GBP/USD 30-minute chart
GBP/USD is off the daily highs while trading above its main SMAs, suggesting a correction up in the near term. Immediate support can be seen at 1.2185, 1.2165, 1.2140/1.2128 support zone and the 1.2103 level, according to the Technical Confluences Indicator.
Additional key levels
