- GBP/USD is trading below the 1.2950 level after the London close.
- Brexit headlines remain the main Cable drivers.
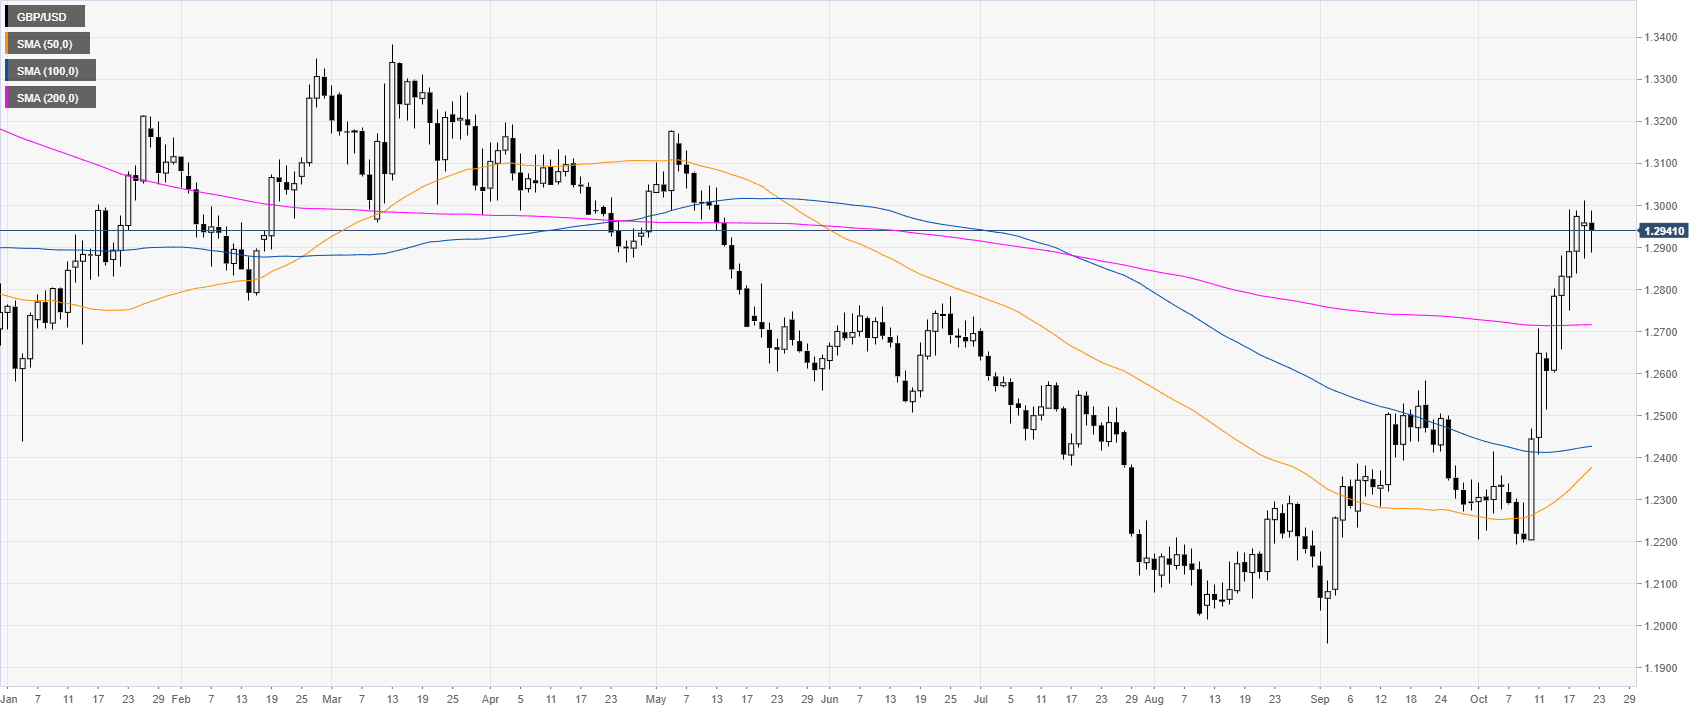
GBP/USD daily chart
The Pound, on the daily chart, had a spike above its main daily simple moving averages (DSMAs) while hitting levels not seen since mid-May 2019. The Brexit deal euphoria is the main driver behind the GBP strength.
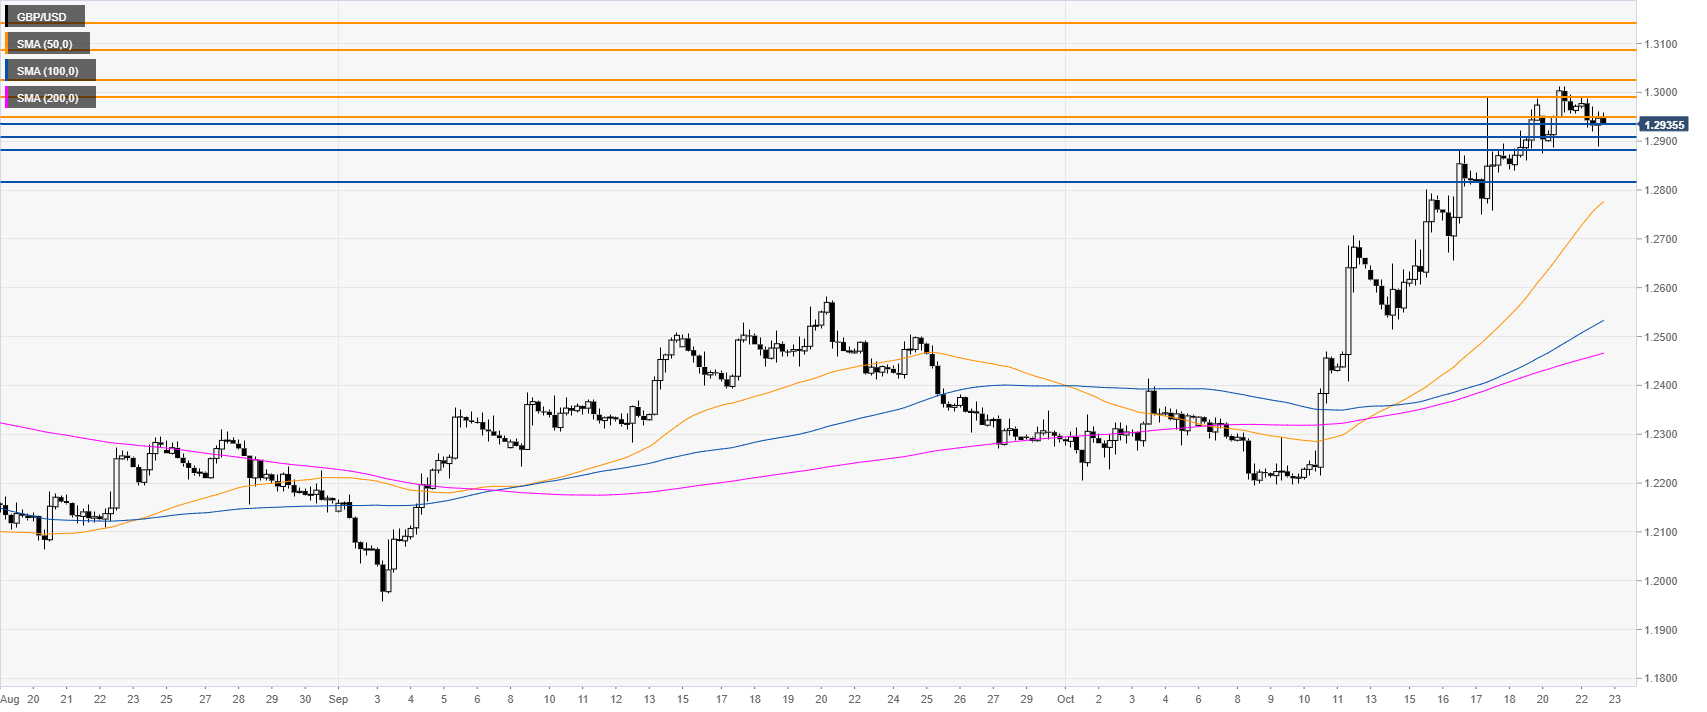
GBP/USD four-hour chart
The Cable is trading in a bullish channel above its main SMAs. However, the market is pulling back down, unable to regain the 1.3000 handle.
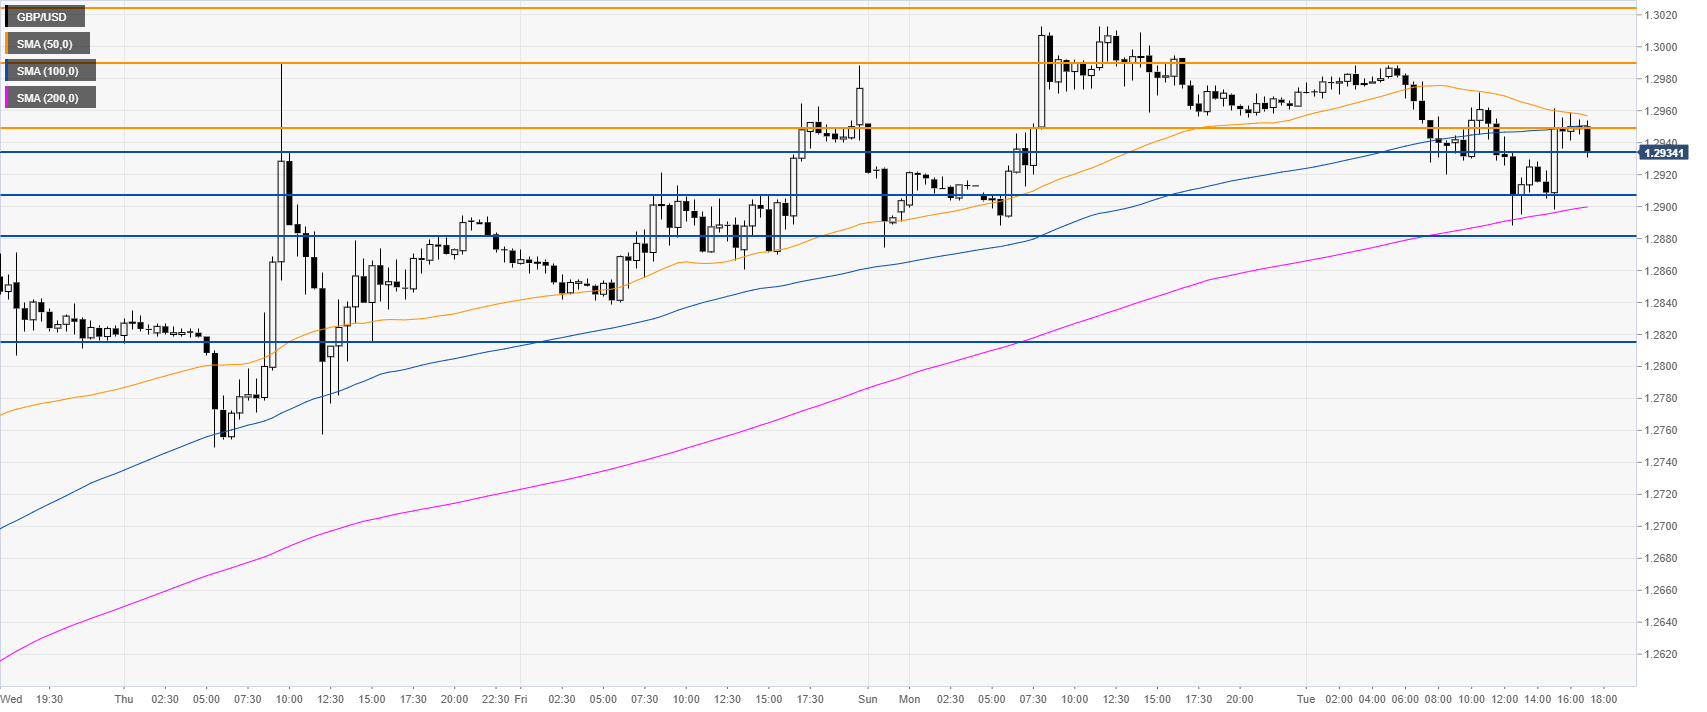
GBP/USD 30-minute chart
GBP/USD is challenging the 1.2935 support. If the sellers can break 1.2881 support, the market could have a spike down towards the 1.2814 level, according to the Technical Confluences Indicator.
On the flip side, a break above 1.2950 resistance can open the doors to a retest of the 1.3000 handle.
Additional key levels
