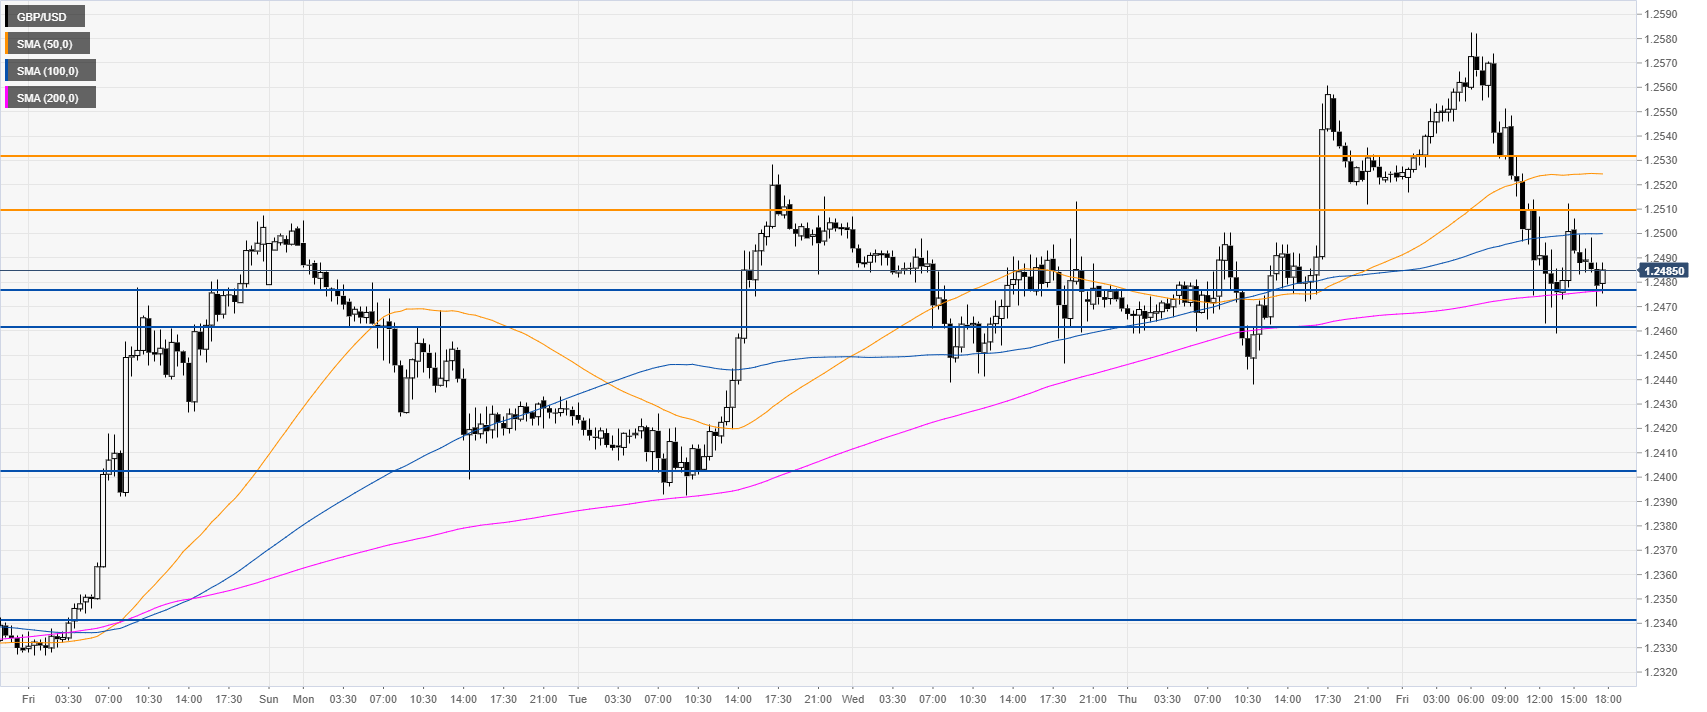
- The Sterling dropped sharply this Friday as EU doubts the UK proposals on Brexit.
- The level to beat for sellers is the 1.2460 support level.
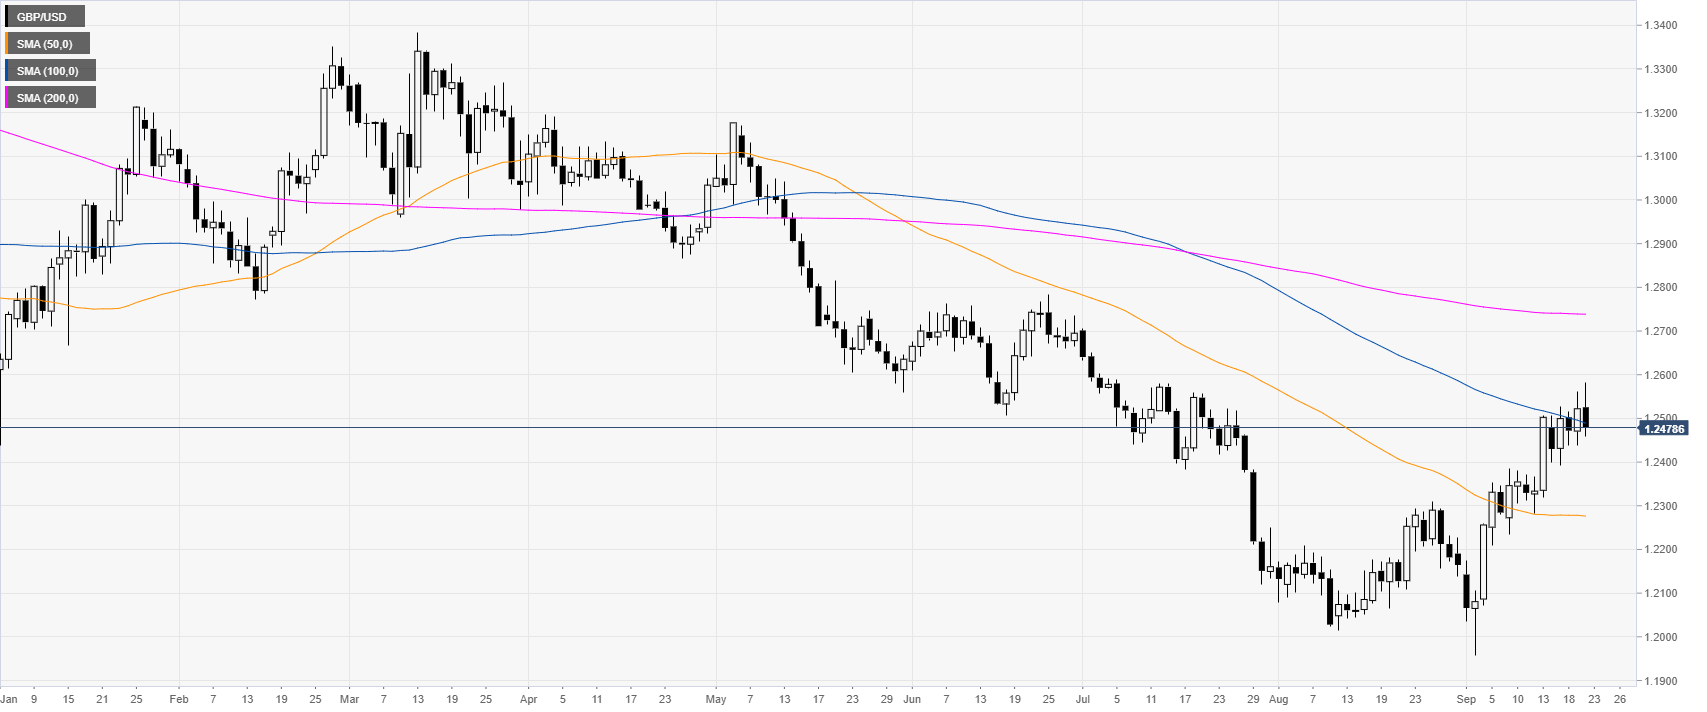
GBP/USD daily chart
The Pound is trading in a bear trend below the 100 and 200-day simple moving averages (SMAs). However, this market has been on the rise in Septembre. It has been fighting for the 1.2500 handle in the last week.
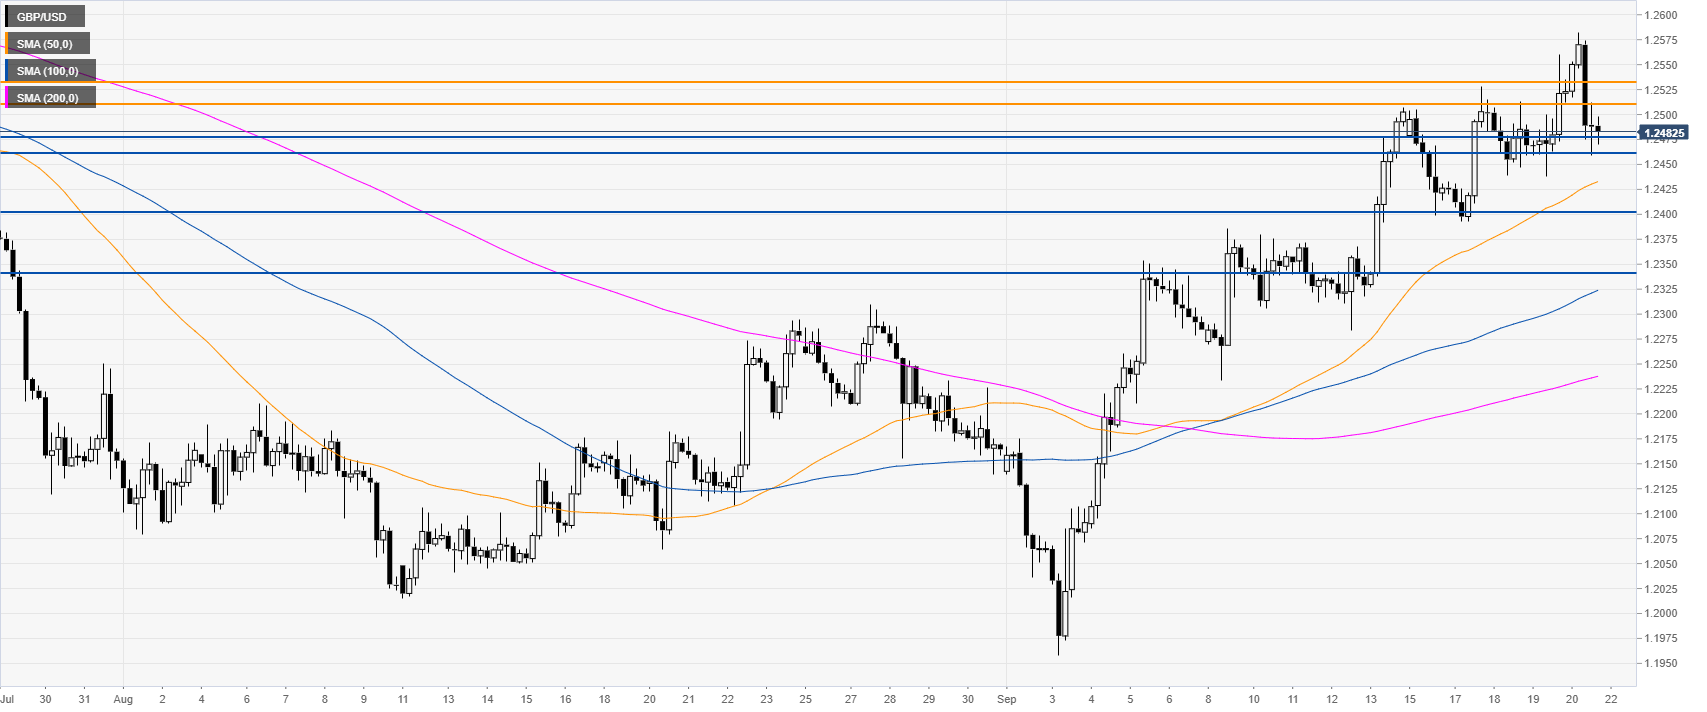
GBP/USD four-hour chart
GBP/USD is trading above the main SMAs, suggesting bullish momentum in the medium term. However, the market is challenging the 1.2460/78 support zone as bears created a sharp reversal down this Friday. If the market break below the 1.2460 level, GBP/USD can correct down towards 1.2405 and 1.2340 price levels, according to the Technical Confluences Indicator.
GBP/USD 30-minute chart
The Sterling is challenging the 200 SMA. Immediate resistance is the 1.2510 level followed by 1.2530 price level, according to the Technical Confluences Indicator.
Additional key levels
