- GBP/USD is bouncing from multi-year lows ahead of the UK’s Member of Parliament’s vote at 21:00 GMT
- A New York close above 1.2095 would be seen as bullish in the short term for the Sterling.
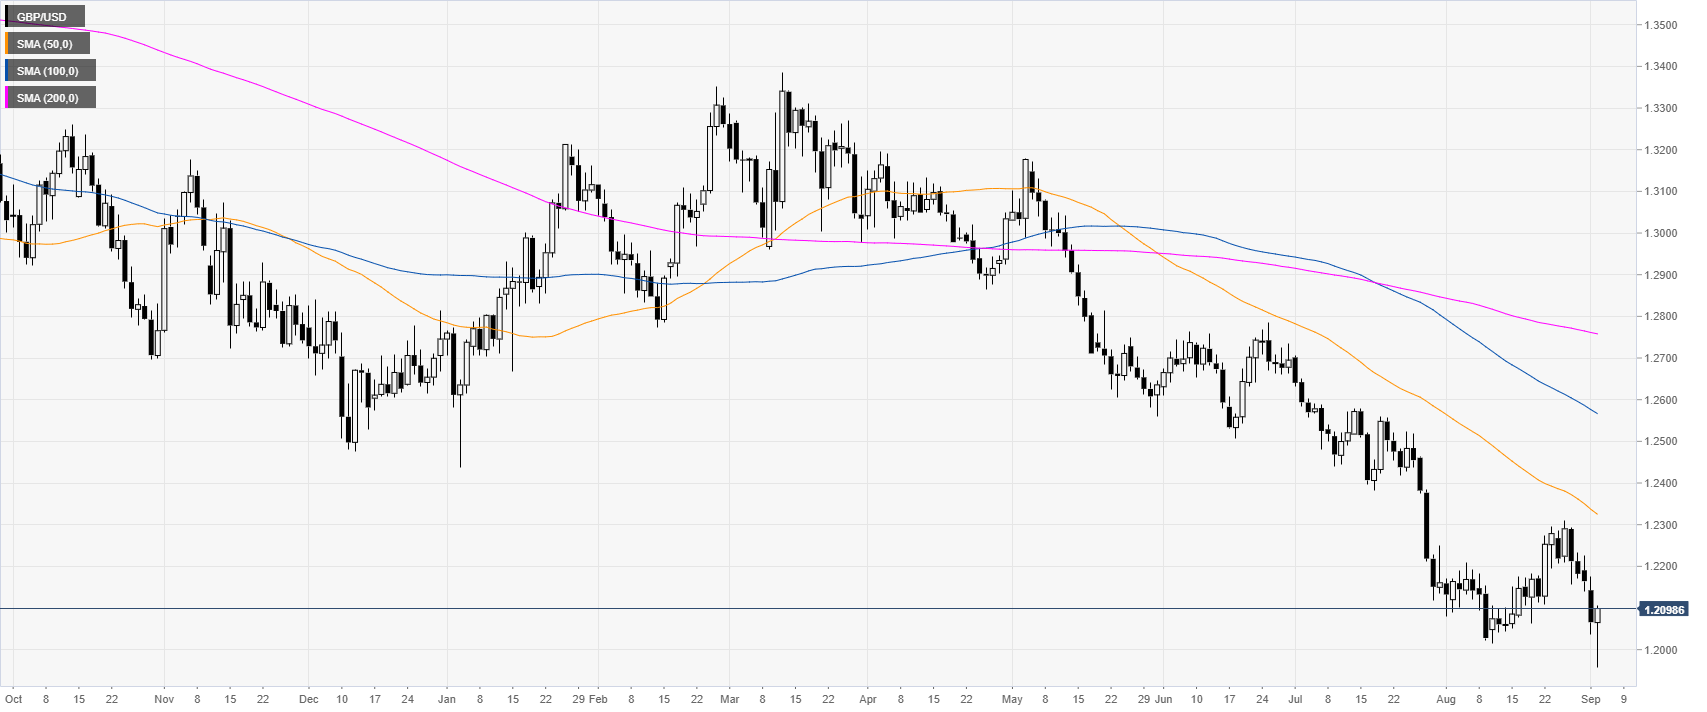
GBP/USD daily chart
The Sterling is trading in a bear trend below its main daily simple moving averages (SMAs). The market is rebounding sharply from multi-year lows ahead of the UK’s Member of Parliament’s vote at 21:00 GMT.
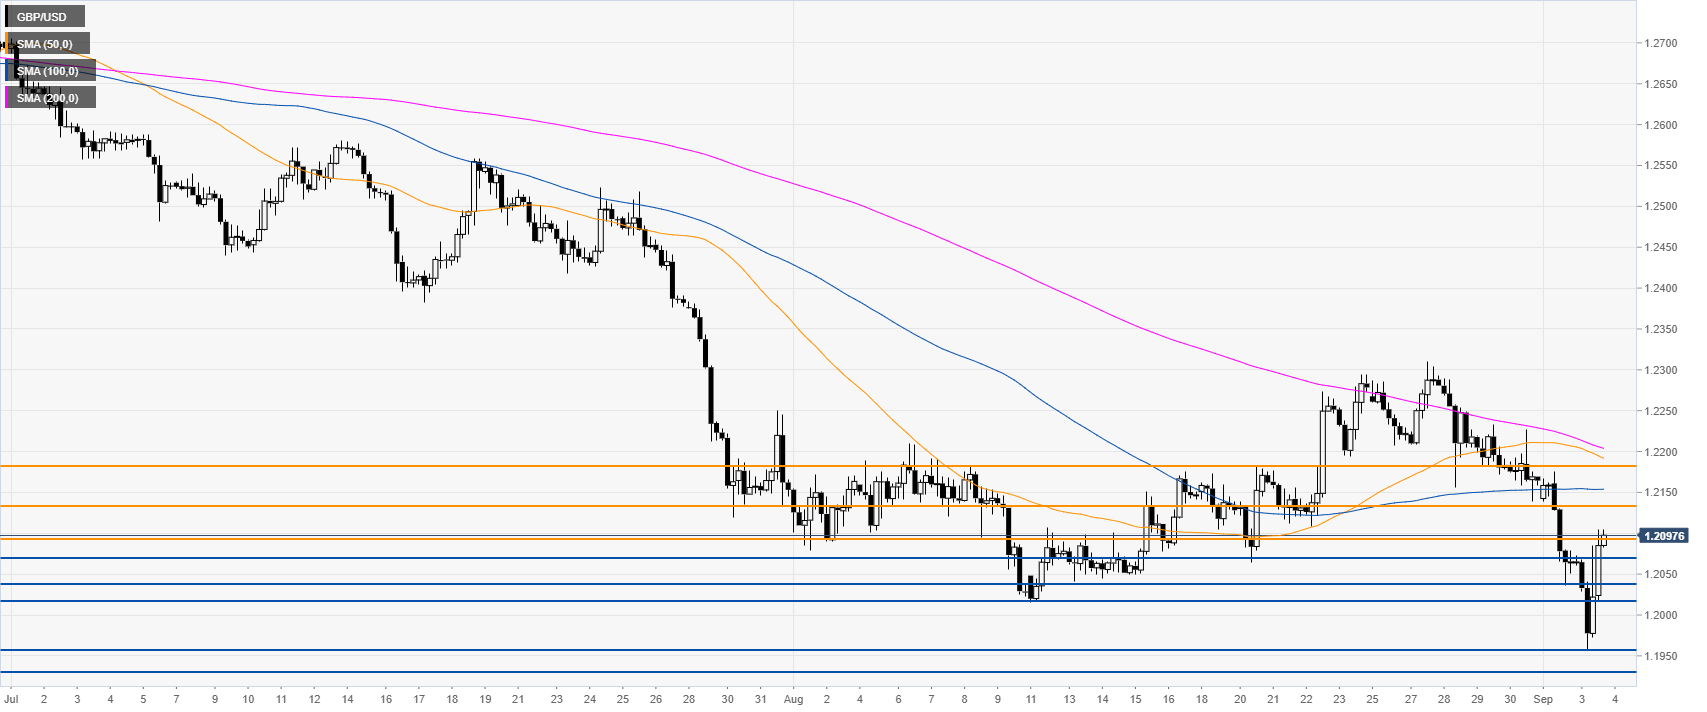
GBP/USD 4-hour chart
GBP/USD is trying to settle above the 1.2095 resistance. If the recovery goes on the next resistances in line can be seen at the 1.2132 and the 1.2182 levels, according to the Technical Confluences Indicator.
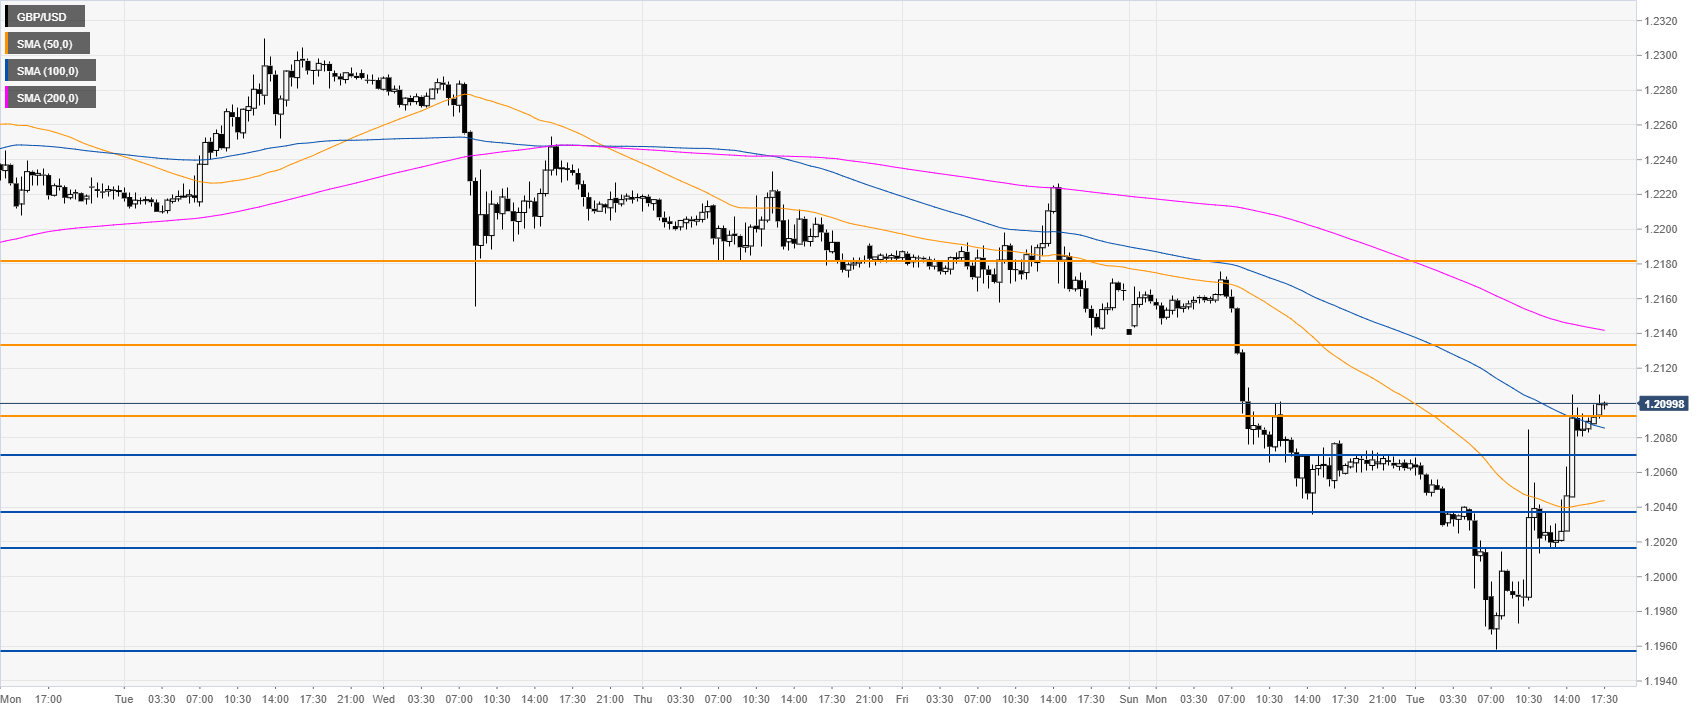
GBP/USD 30-minute chart
GBP/USD is flirting with the daily highs near the 1.2095 resistance and the 100 SMA, suggesting a correction up in the near term. Immediate support can be seen at the 1.2070, 1.2038, and 1.2018, according to the Technical Confluences Indicator.
Additional key levels
