- GBP/USD is trading in a tight range in the New York session.
- The level to beat for sellers is the 1.2835 support.
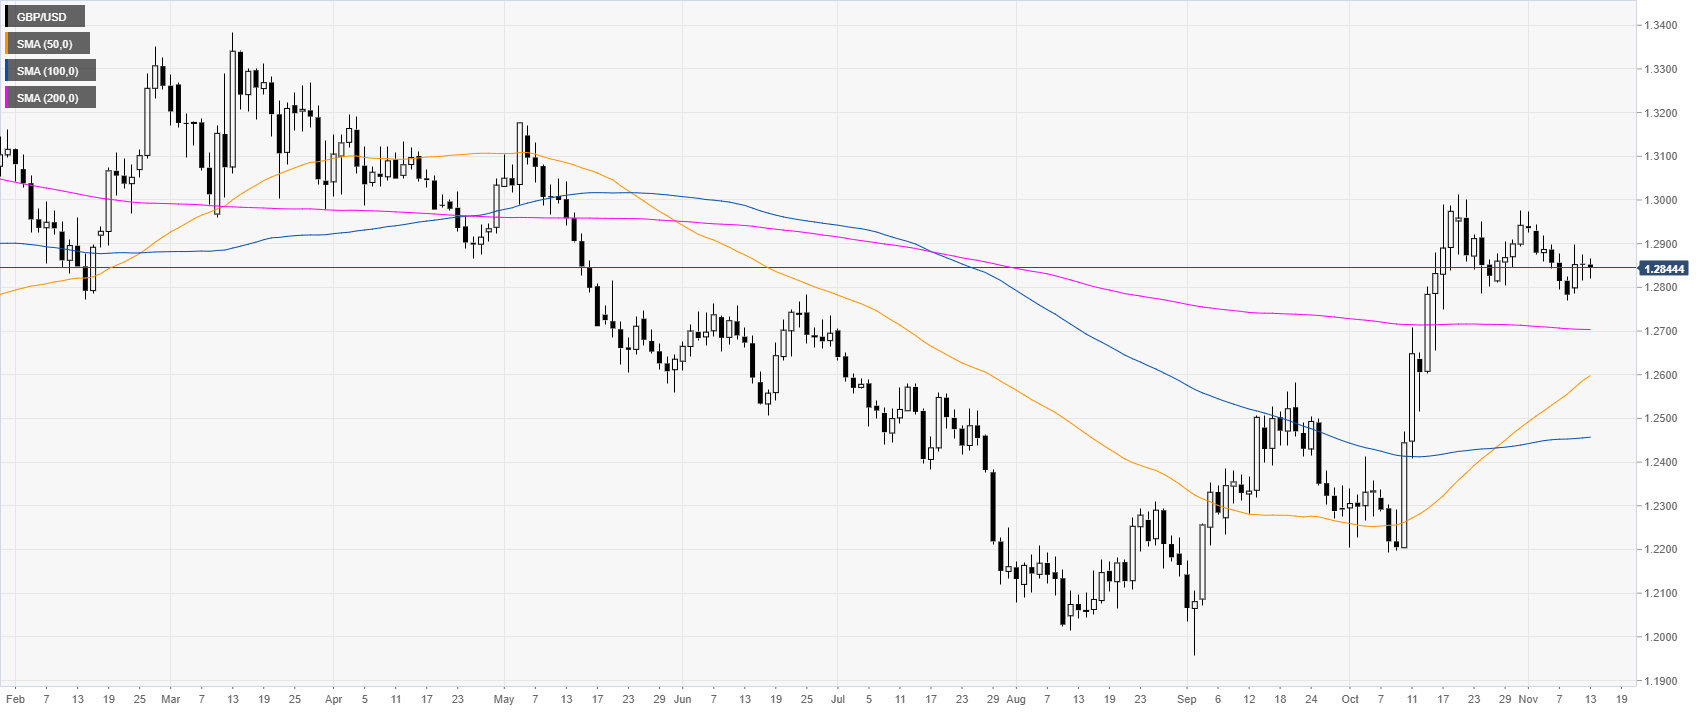
GBP/USD daily chart
The Sterling is currently correcting the October bull run in the 1.2800-1.3000 price zone. The Cable, last month, reached levels not seen since mid-May 2019.
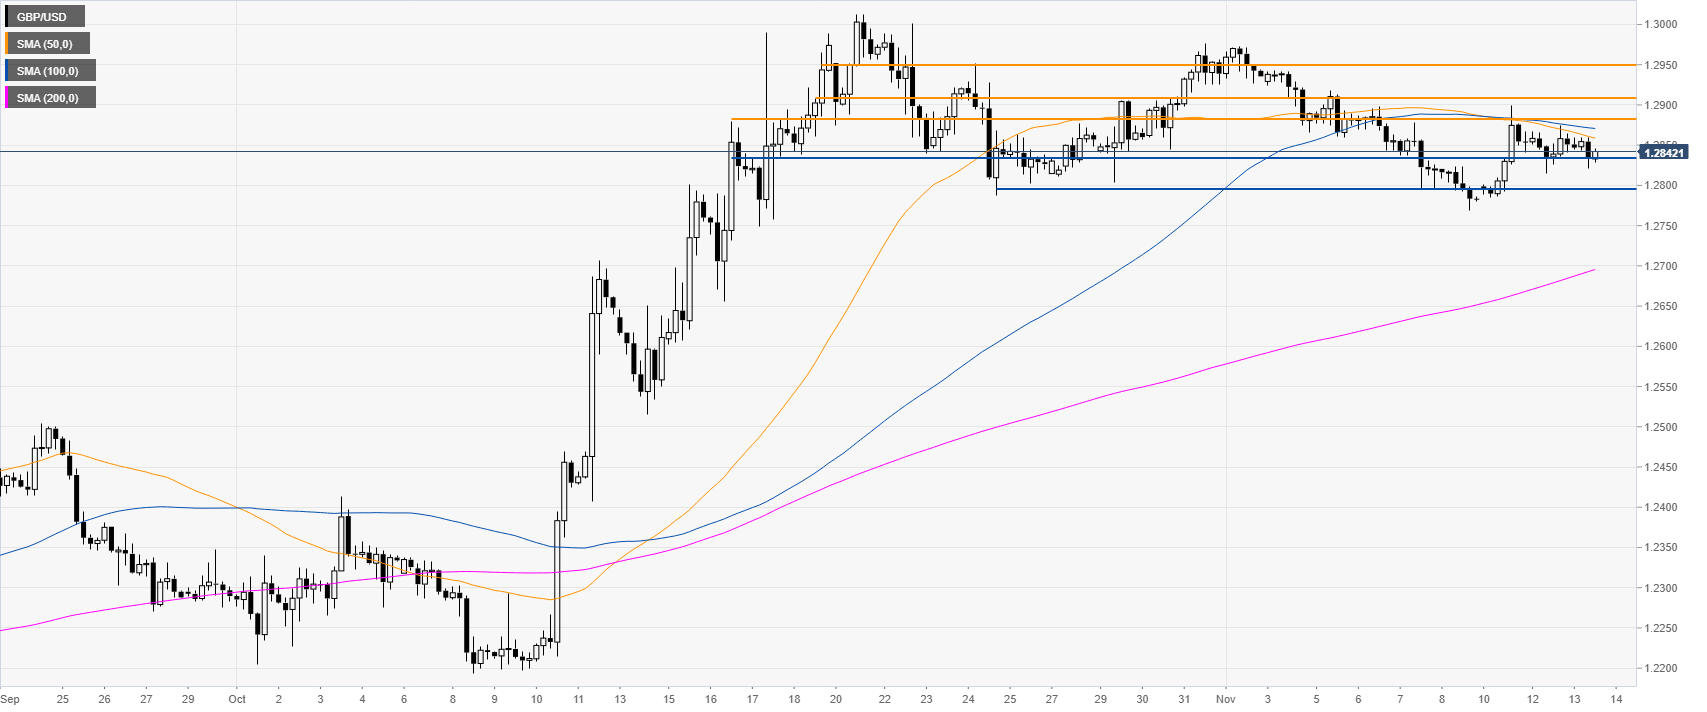
GBP/USD four-hour chart
GBP/USD is trading in a tight range between the 1.2835 support and 1.2882/1.2900 resistance zone. The spot is limited by downward sloping 50 and 100 SMAs suggesting that the market might continue to drift lower in the medium term.
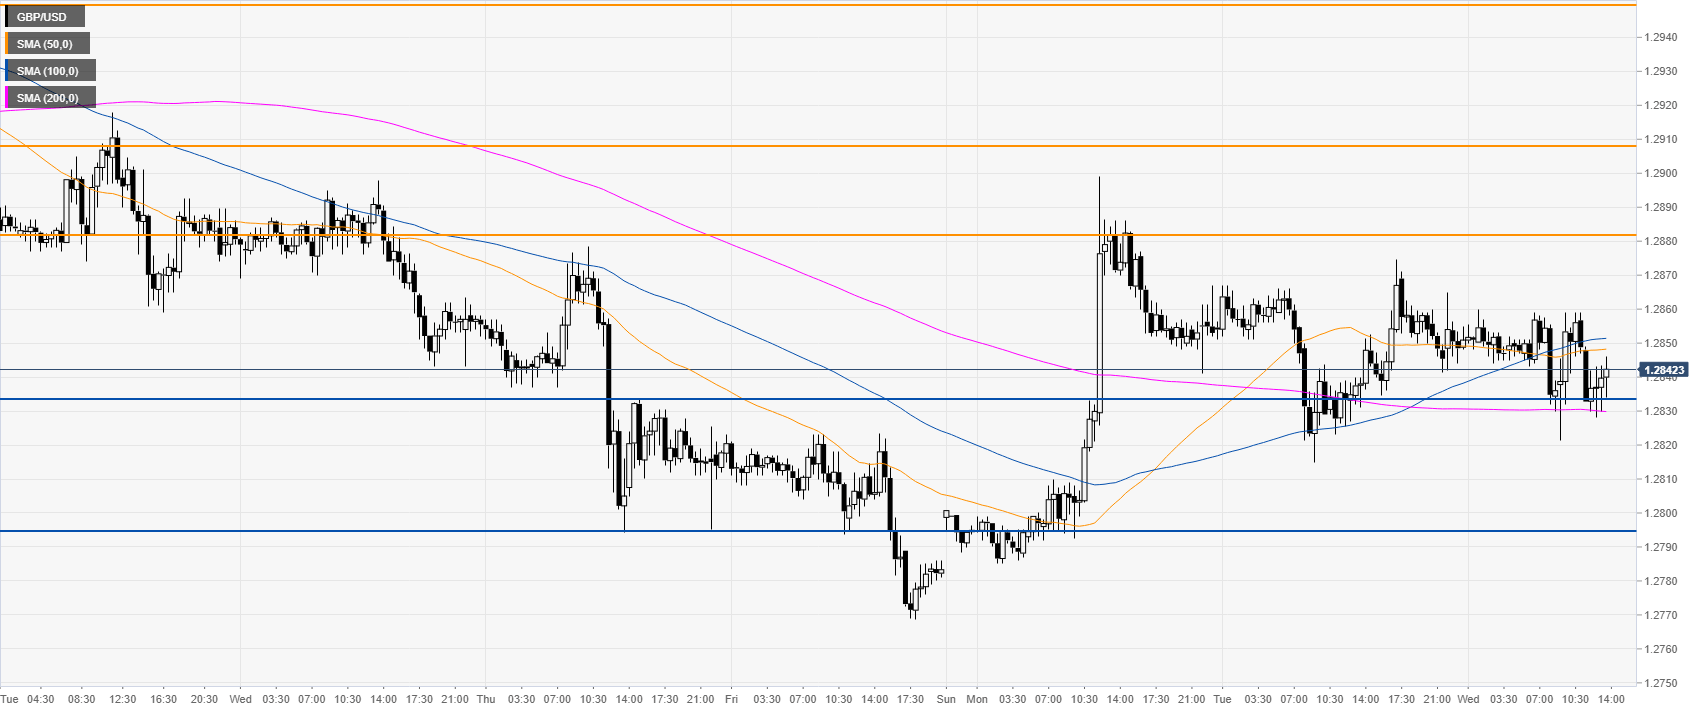
GBP/USD 30-minute chart
The market is looking for a clear direction. If the buyers give up, the market can slide to 1.2795 support. Resistance is seen at the 1.2882/1.2900 zone, according to the Technical Confluences Indicator.
Additional key levels
