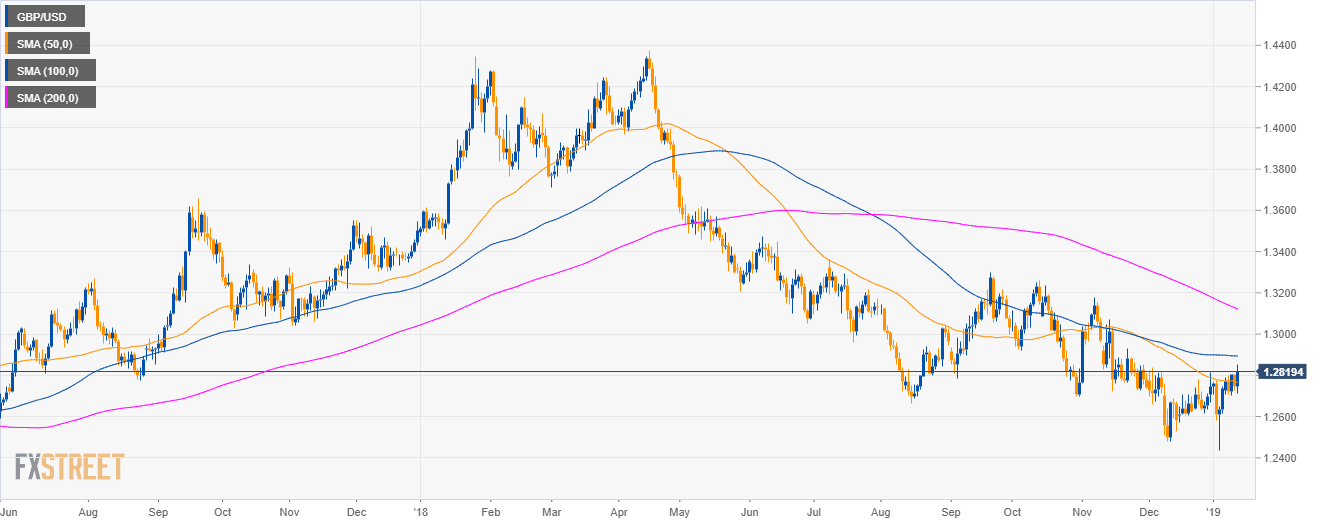
GBP/USD daily chart
- GBP/USD is trading in a bear trend below the 100 and 200 SMA.
- The US CPI (Consumer Producer Index) for December y/y came in line with expectations at 2.2% with limited market reaction.
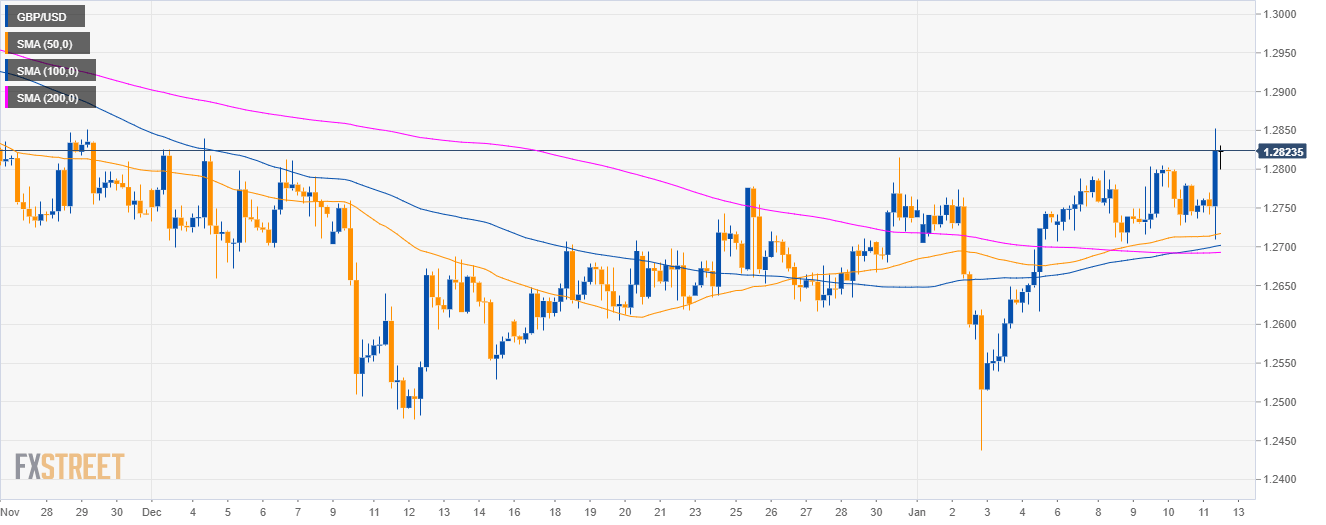
GBP/USD 4-hour chart
- GBP/USD is trading above its main SMAs as the market is at its highest since the start of 2019.
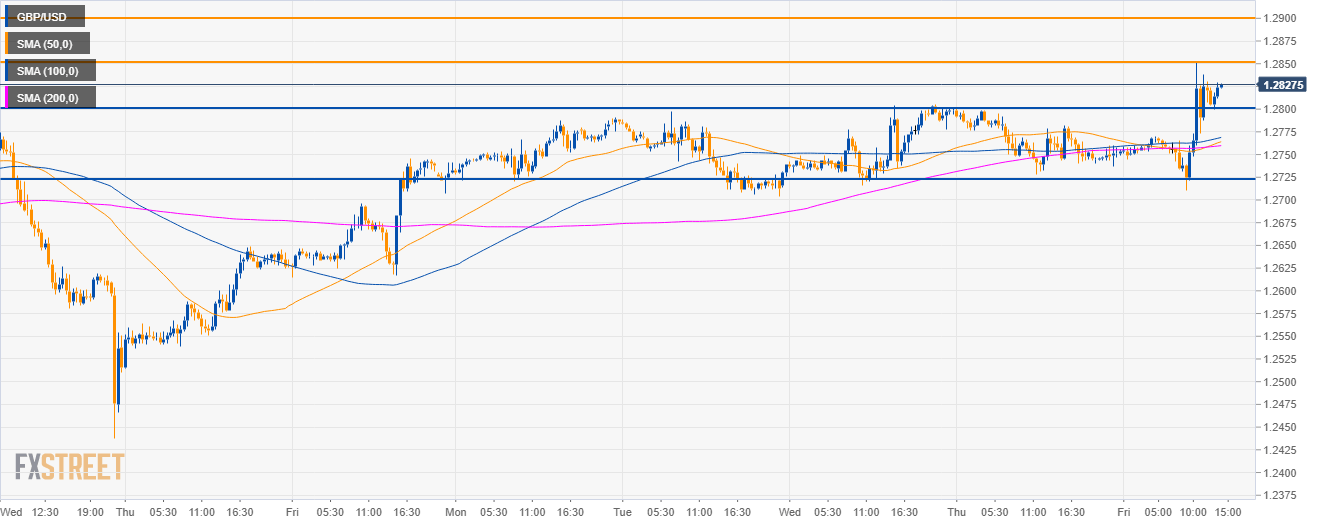
GBP/USD 30-minute chart
- Bulls pierced the 1.2800 resistance and are now trying to attack the 1.2850 resistance. A break of the level would open the door to 1.2900 resistance.
- On the flip side, bears will try to resume the main bear trend by pushing the market below the 1.2800 figure. A break of the level can lead to 1.2725 to the downside.
Additional key levels
GBP/USD
Overview:
Today Last Price: 1.2824
Today Daily change: 78 pips
Today Daily change %: 0.612%
Today Daily Open: 1.2746
Trends:
Previous Daily SMA20: 1.2682
Previous Daily SMA50: 1.2769
Previous Daily SMA100: 1.2894
Previous Daily SMA200: 1.313
Levels:
Previous Daily High: 1.2805
Previous Daily Low: 1.2728
Previous Weekly High: 1.2815
Previous Weekly Low: 1.2438
Previous Monthly High: 1.284
Previous Monthly Low: 1.2477
Previous Daily Fibonacci 38.2%: 1.2757
Previous Daily Fibonacci 61.8%: 1.2776
Previous Daily Pivot Point S1: 1.2714
Previous Daily Pivot Point S2: 1.2682
Previous Daily Pivot Point S3: 1.2637
Previous Daily Pivot Point R1: 1.2791
Previous Daily Pivot Point R2: 1.2837
Previous Daily Pivot Point R3: 1.2869
