- The Cable is starting the week on the defensive breaking below the 1.2100 handle.
- The levels to beat for sellers are seen at 1.2065, followed by 1.2035 support levels.
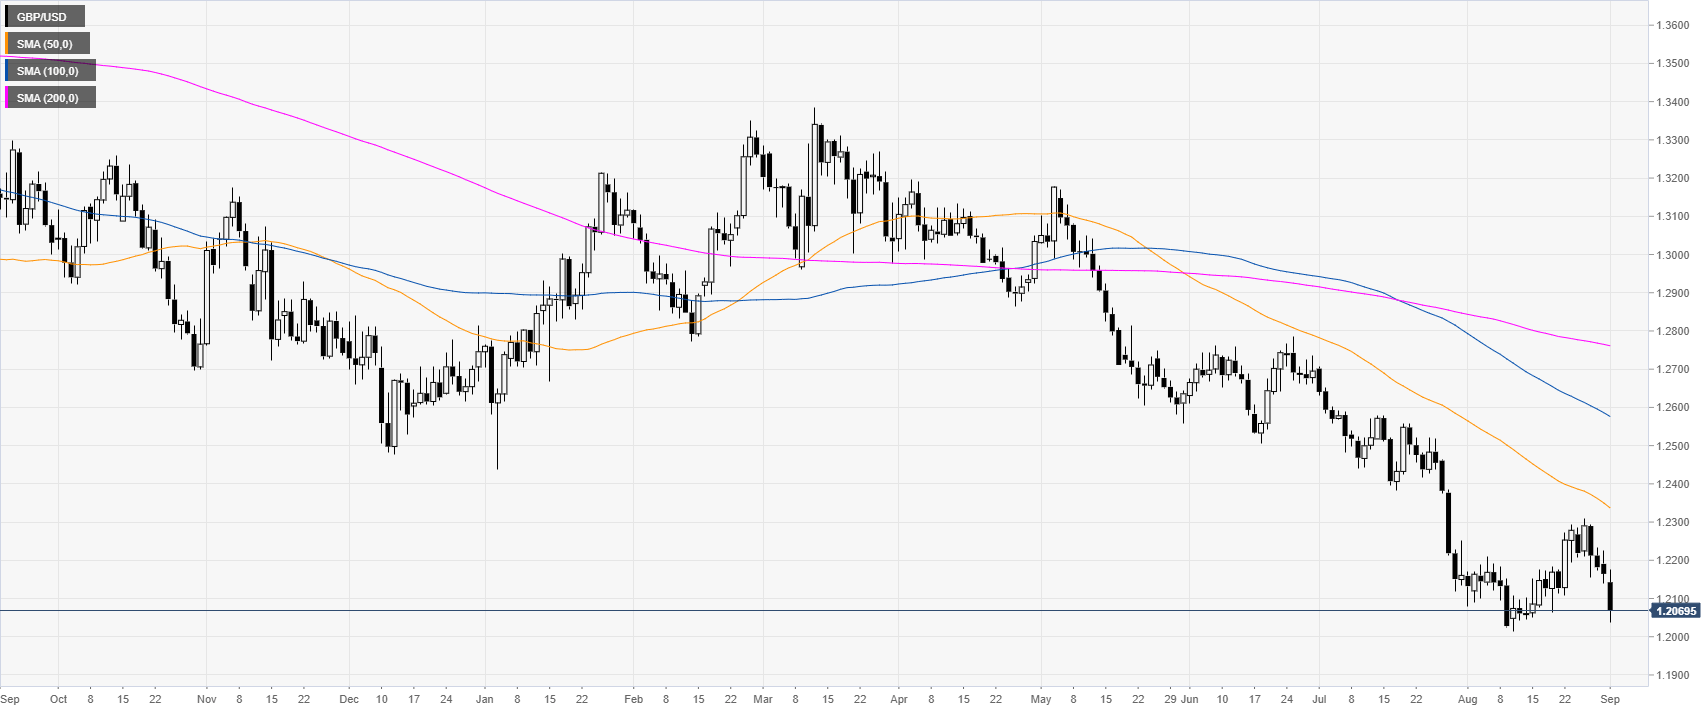
GBP/USD daily chart
The GBP/USD currency pair is trading in a bear trend below its main daily simple moving averages (SMAs). GBP/USD is on the backfoot as rumors for a snap election in the UK is weighing on the Sterling.
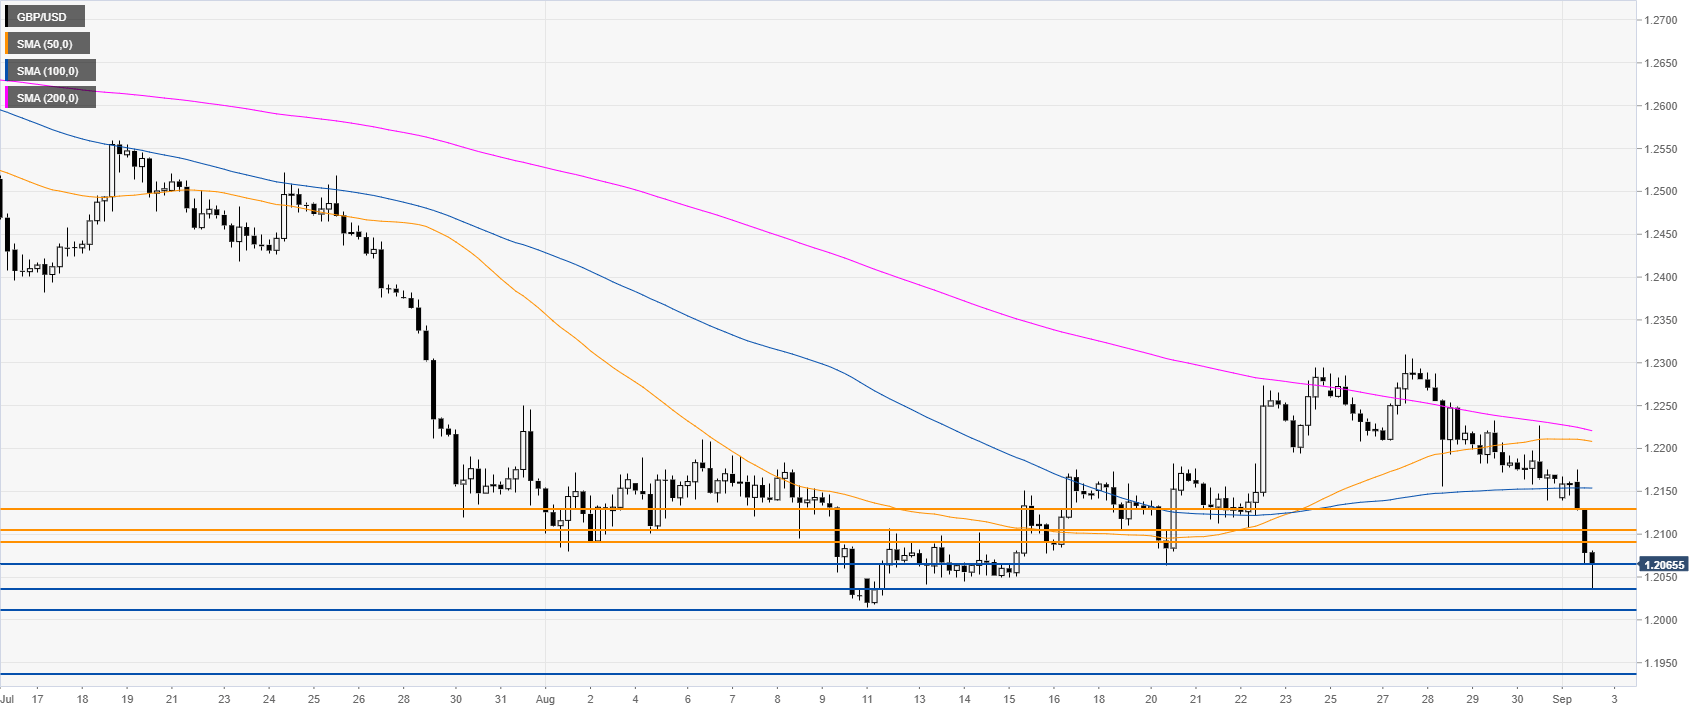
GBP/USD 4-hour chart
The Cable is confined below 1.2091/1.2104 resistance zone and the main SMAs on the 4-hour time frame. The level to beat for bears is seen at the 1.2065 followed by 1.2035/1.2010 zone and 1.1935 level on the way down, according to the Technical Confluences Indicator.
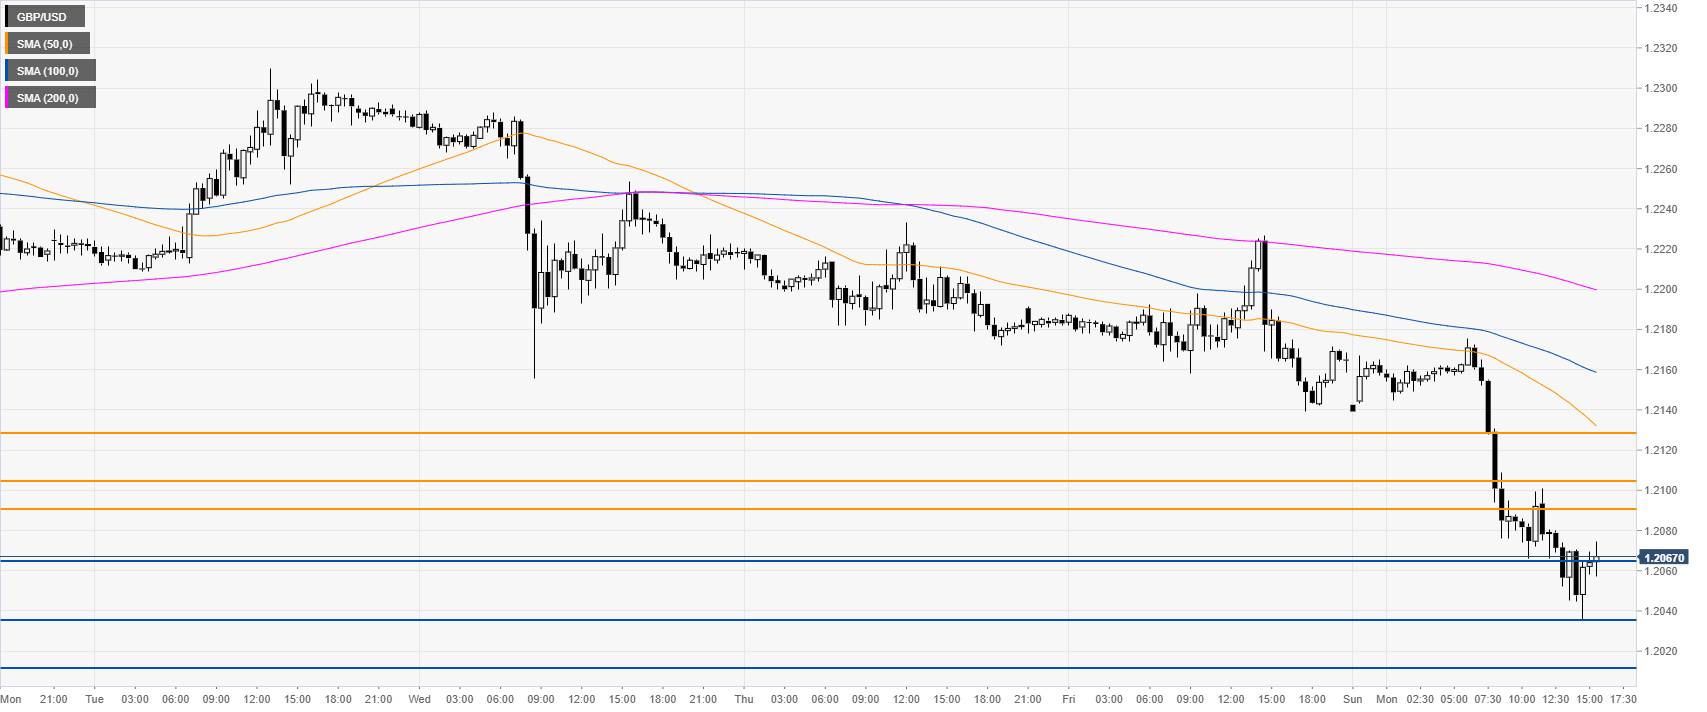
GBP/USD 30-minute chart
GBP/USD is trading below the main SMAs, suggesting a bearish bias in the near term. The market is having a consolidation just above the 1.2065 level. Immediate resistances are seen at the 1.2091/1.2104 levels followed by 1.2130, according to the Technical Confluences Indicator.
Additional key levels
