- GBP/USD remains sidelined in the New York session.
- The level to beat for bears is the 1.2834 support.
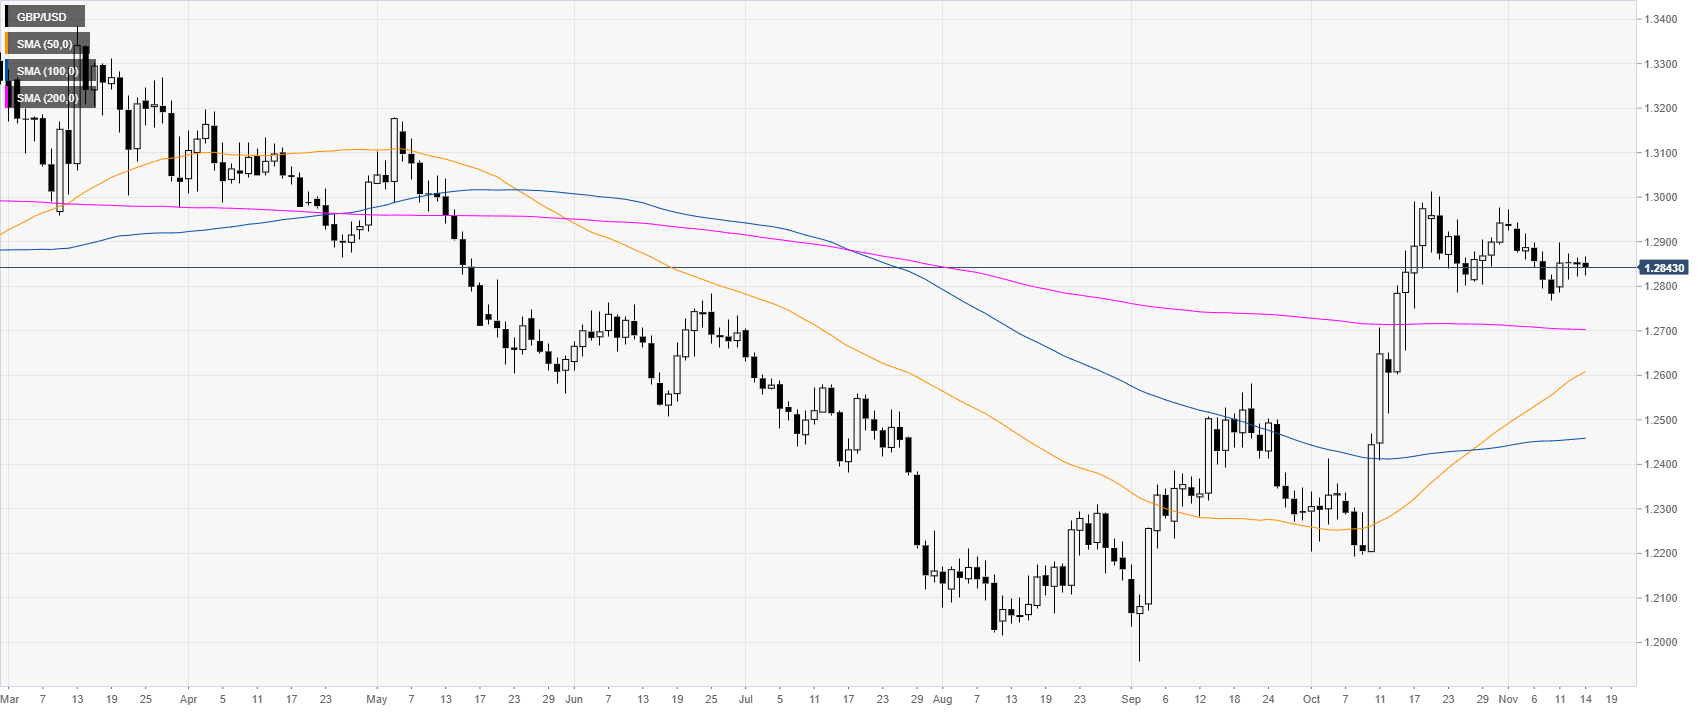
GBP/USD daily chart
The pound is currently correcting last month’s rally in the 1.2800-1.3000 price zone. GBP/USD, in October, hit levels not seen since mid-May 2019.
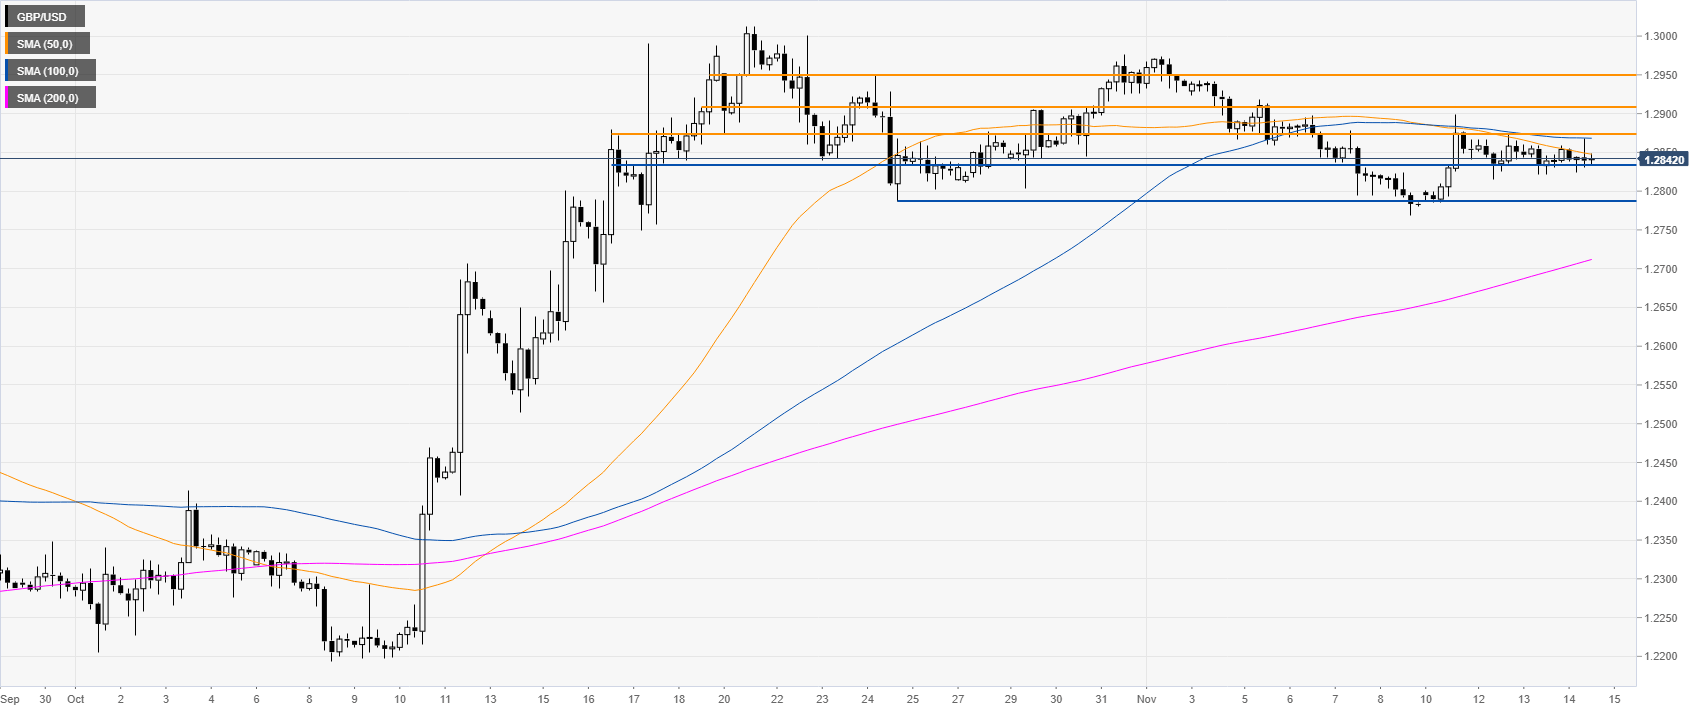
GBP/USD four-hour chart
GBP/USD is trading in a tight range between the 1.2834 support and the 1.2874 resistance. The spot is capped by downward sloping 50 and 100 SMAs suggesting that the spot might continue to drift lower in the medium term.
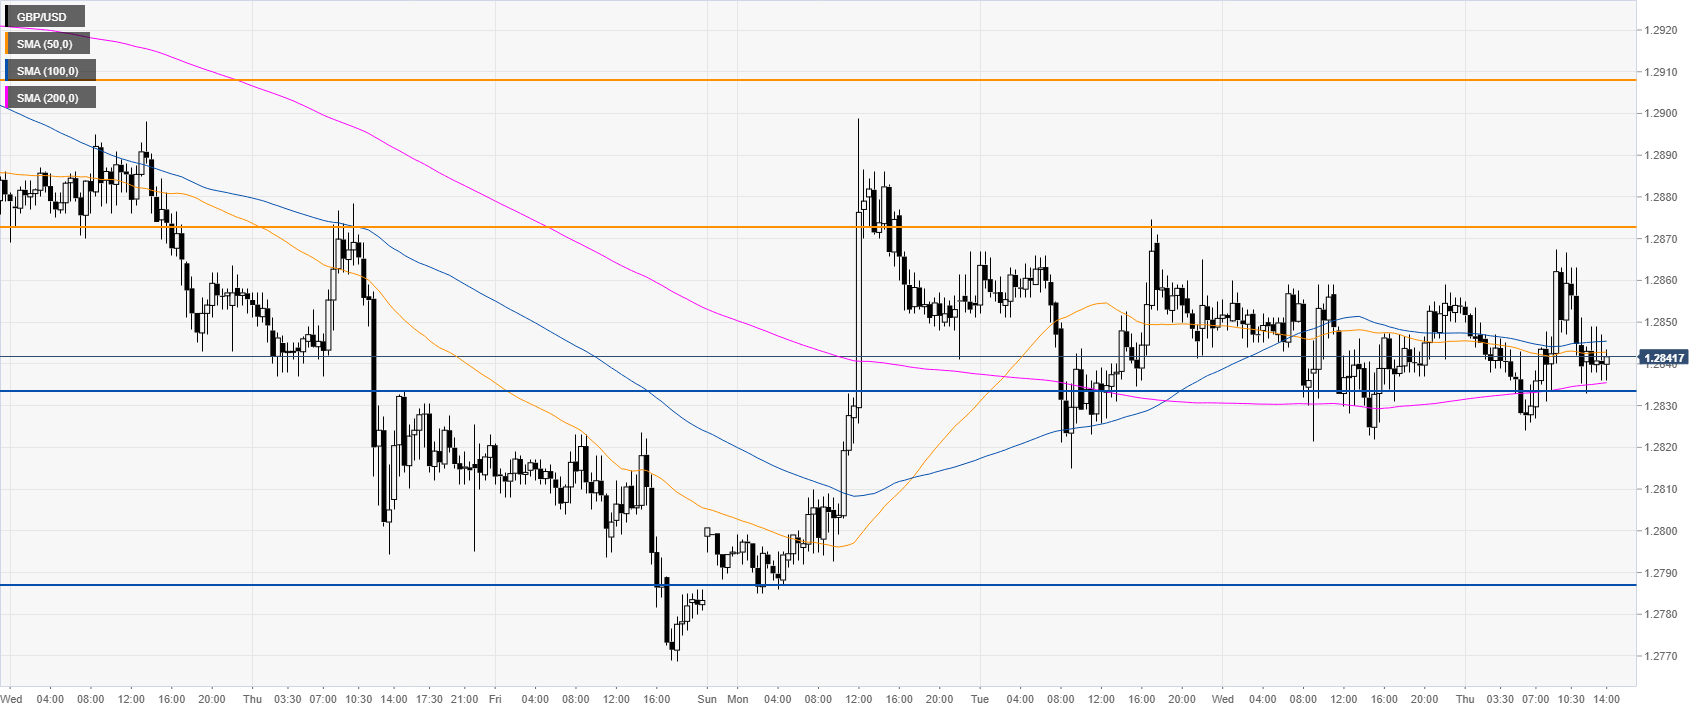
GBP/USD 30-minute chart
The market is keeping the weekly range theme intact. If the bulls give up, the spot can slide towards 1.2790 support. Resistance is seen at the 1.2874/1.2900 zone, according to the Technical Confluences Indicator.
Additional key levels
