- GBP/USD is in a bull trend as the market is trading above the 50, 100 and 200-period simple moving average.
- GBP/USD broke above the 1.3200 figure as it is nearing the 1.3300 (September 20 swing high). The Stochastic indicator is in overbought condition suggesting that the bull run might be exhausting itself. However, there is no sign of a top yet and the market might potentially spike to 1.3300 figure in the meanwhile.
- A bear breakout below 1.3100 would likely invalidate the bullish bias.
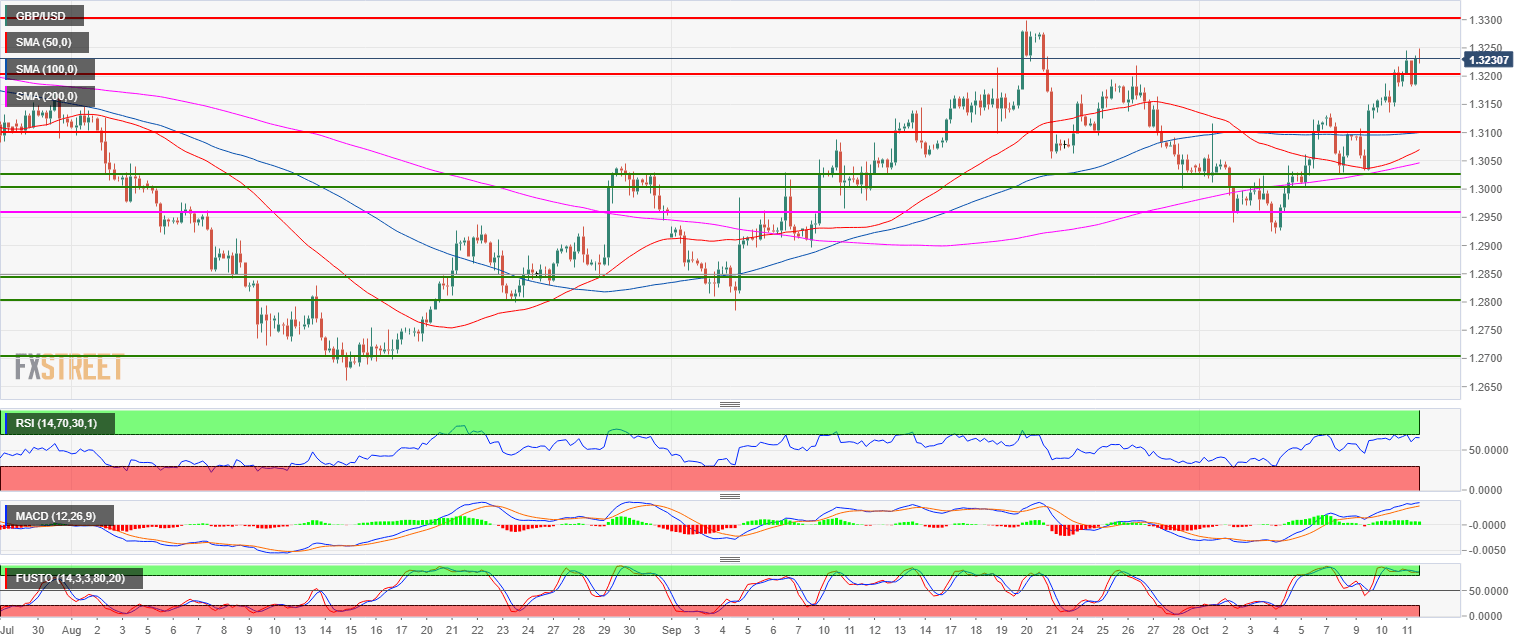
Spot rate: 1.3229
Relative change: 0.30%
High: 1.3245
Low: 1.3182
Main trend: Bullish
Resistance 1: 1.3300 September 20 high
Resistance 2: 1.3370 July 9 high
Resistance 3: 1.3400 figure
Support 1: 1.3200 figure
Support 2: 1.3150 September 21 low
Support 3: 1.3100 figure
Support 4: 1.3050 August 30 swing high, key level
Support 5: 1.3028 October 8 low
Support 6: 1.3000 figure
Support 7: 1.2957 July 19 swing low
