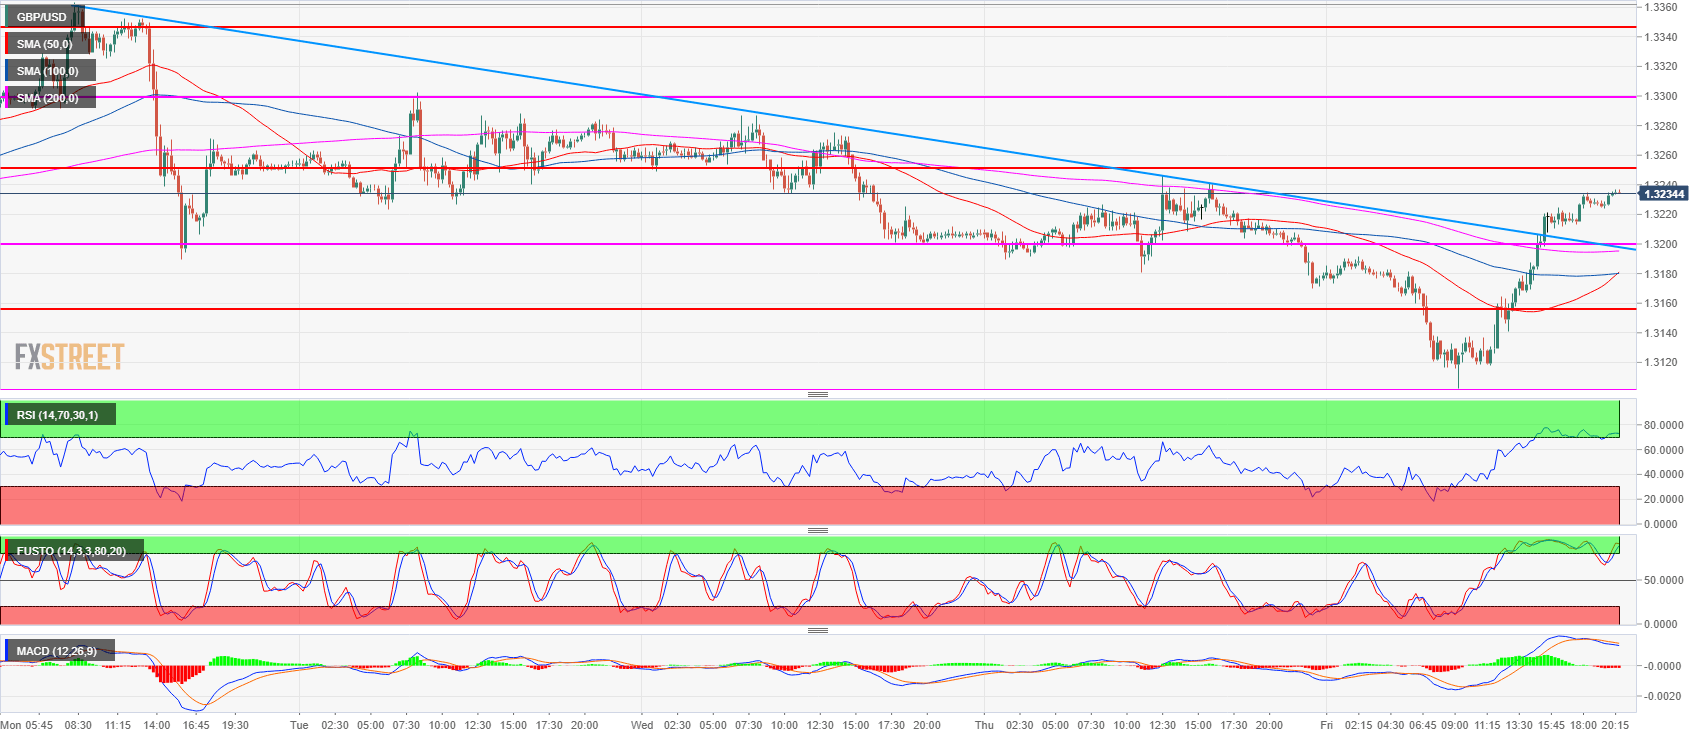
- GBP/USD reversed all its losses made previously on Friday and is set to end the day 0.22% in the green.
- GBP/USD has cleared the 1.3200 resistance and is less than 20 pips away from the 1.3250 resistance.
- The 50-period simple period moving average is about to cross above the 100-period SMA suggesting that bullish momentum is building up. Next week bulls will set their eyes on the 1.3300 figure and 1.3363 the current weekly high.
Spot rate: 1.3234
Relative change: 0.22%
High: 1.3236
Low: 1.3102
Trend: Bullish
Resistance 1: 1.3250 June 4 high
Resistance 2: 1.3300 figure
Resistance 3: 1.3363 weekly high
Resistance 4: 1.3400 figure
Resistance 5: 1.3472 June’s high
Support 1: 1.3200 figure
Support 2: 1.3155 former breakout point
Support 3: 1.3100 figure
Support 4: 1.3049 current 2018 low
Support 5: 1.3027 October 6, 2017 swing low
