- The cable is trading at weekly highs in the New York session.
- The level to beat for bulls is the 1.2964 resistance.
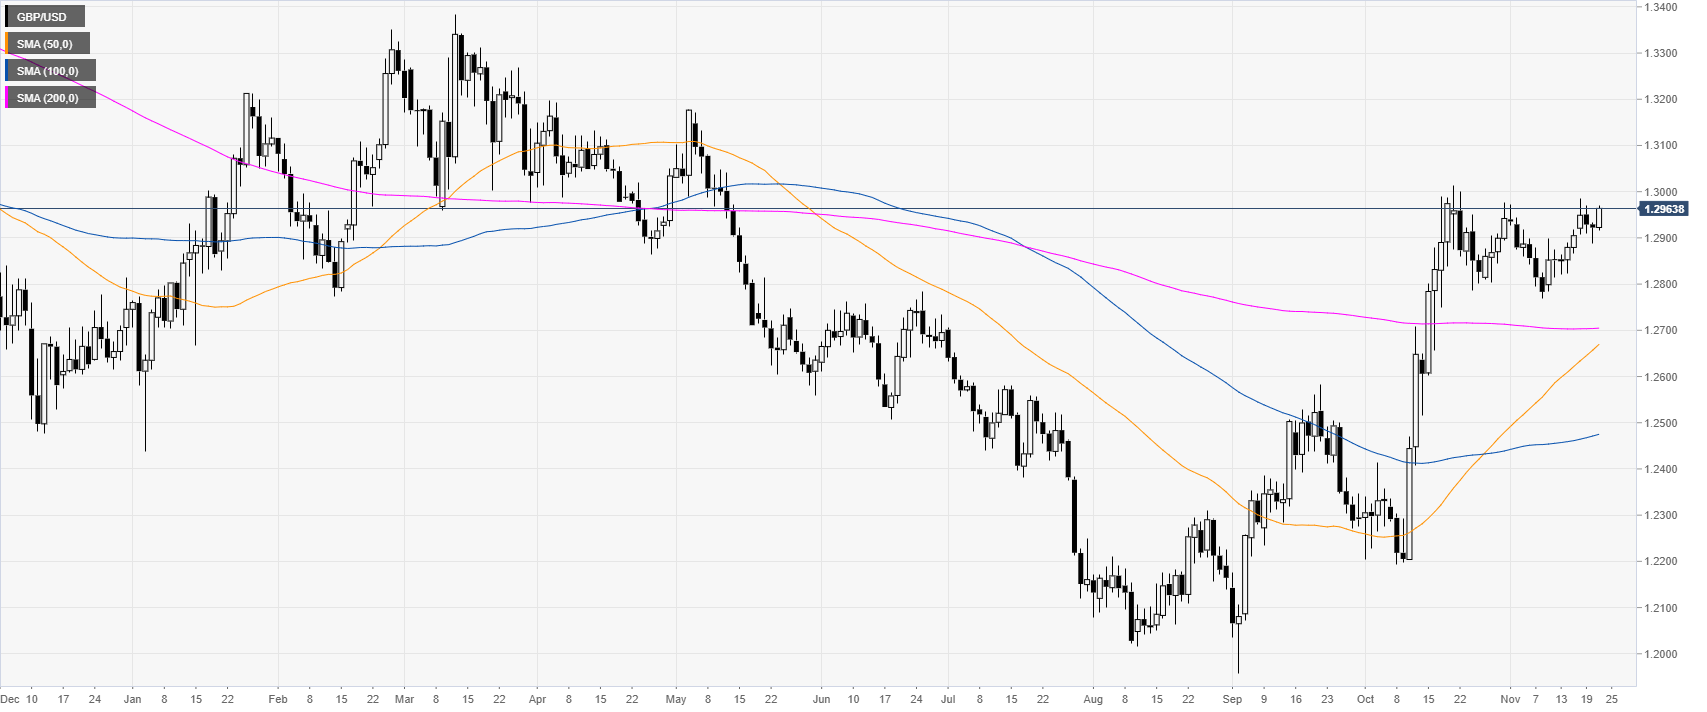
GBP/USD daily chart
The Sterling is clinging to the November highs approaching the 1.3000 handle while above its main daily simple moving averages (DMAs).
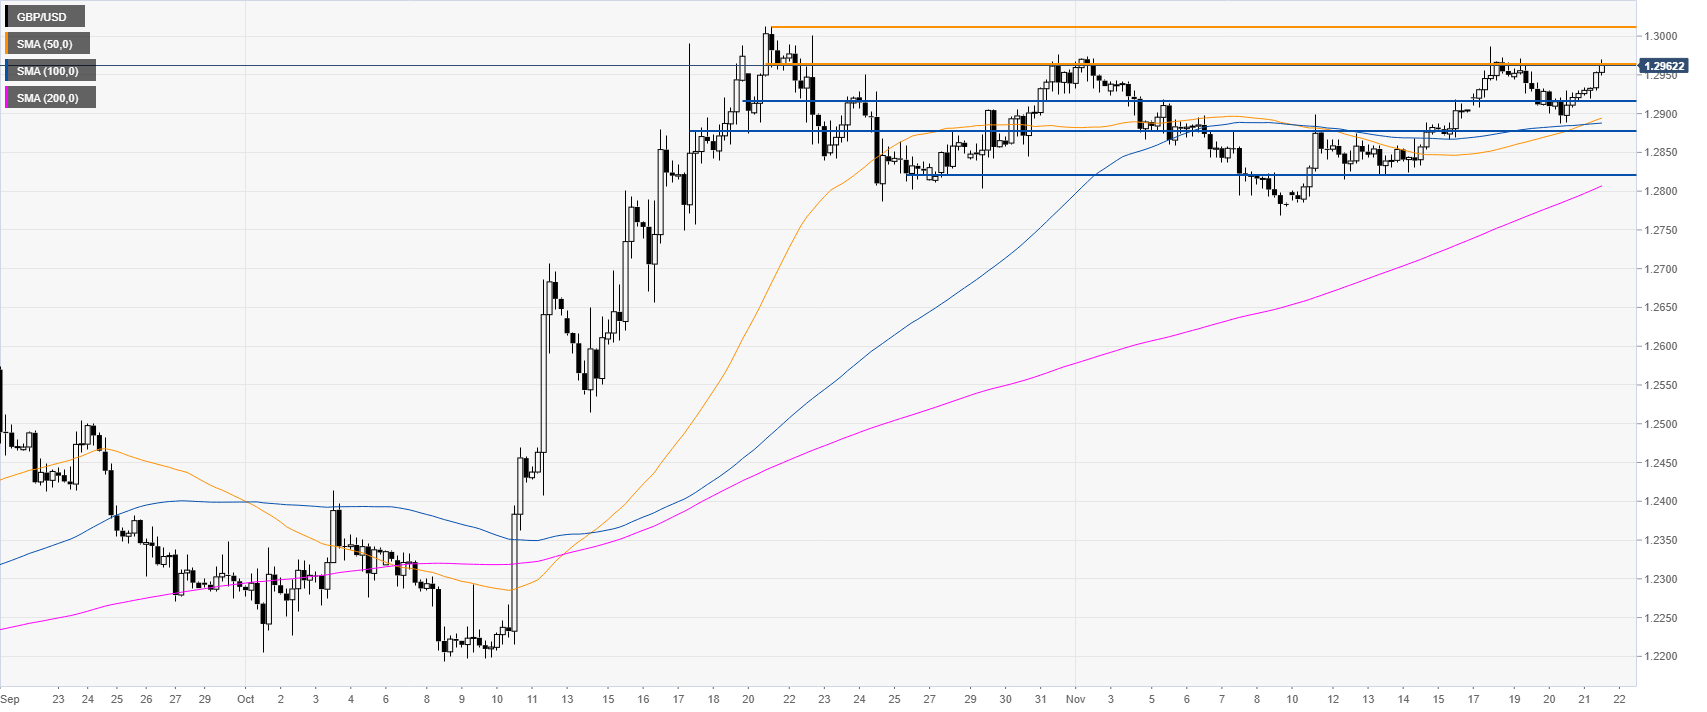
GBP/USD four-hour chart
The market is challenging the 1.2964 resistance while trading above its main SMAs, suggesting bullish momentum in the medium term. A break above the resistance level can lead to further strength towards the 1.3012 and 1.3093 price levels, according to the Technical Confluences Indicator
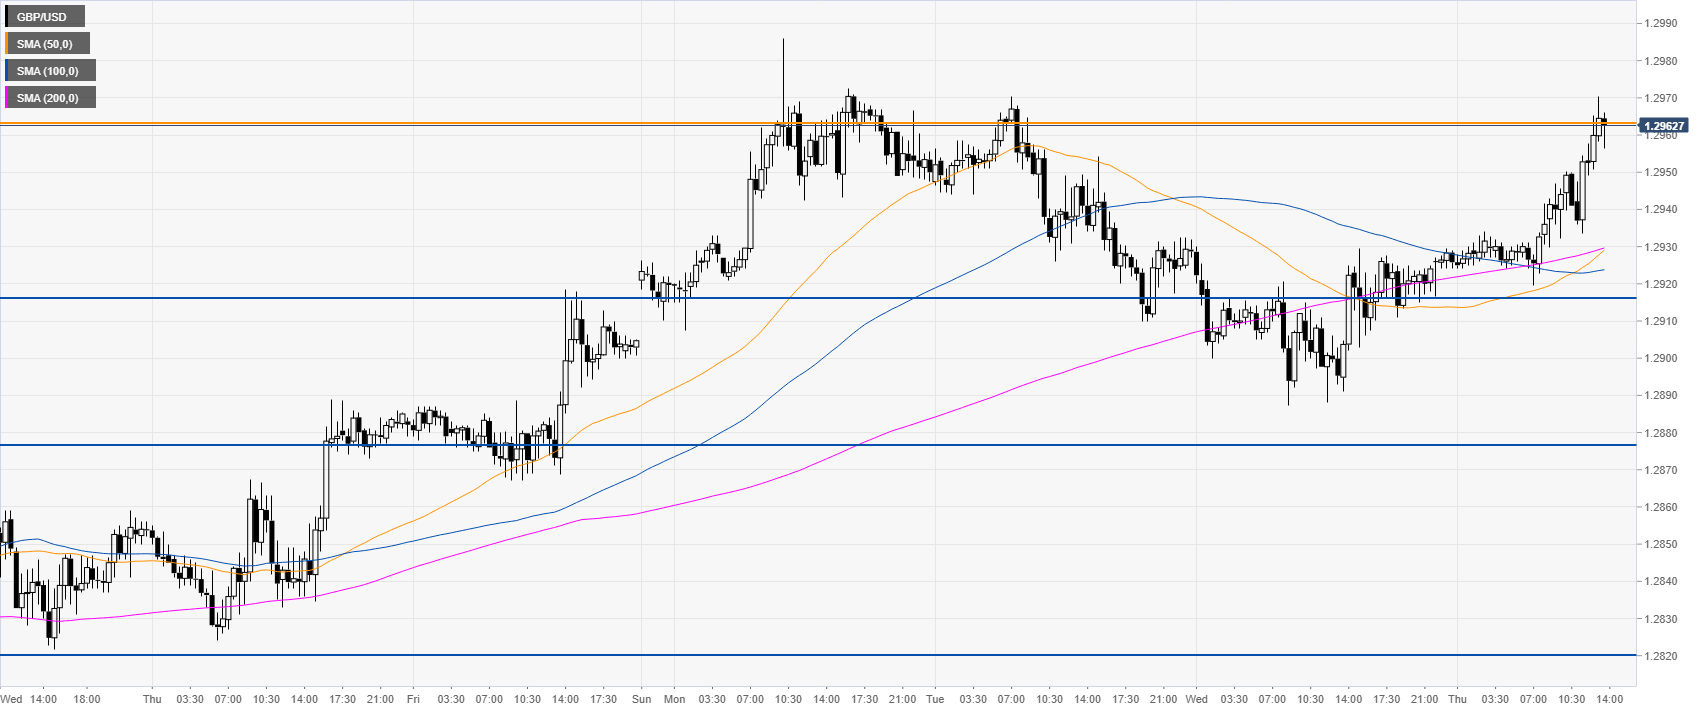
GBP/USD 30-minute chart
The market is trading just above the main SMAs, suggesting a bullish bias in the near term. Support is seen at the 1.2918, 1.2877 and 1.2824 price levels.
Additional key levels
