- GBP/USD is consolidating the intraday gains by trading off the daily high.
- The market reached 4-day high to 1.2176 level.
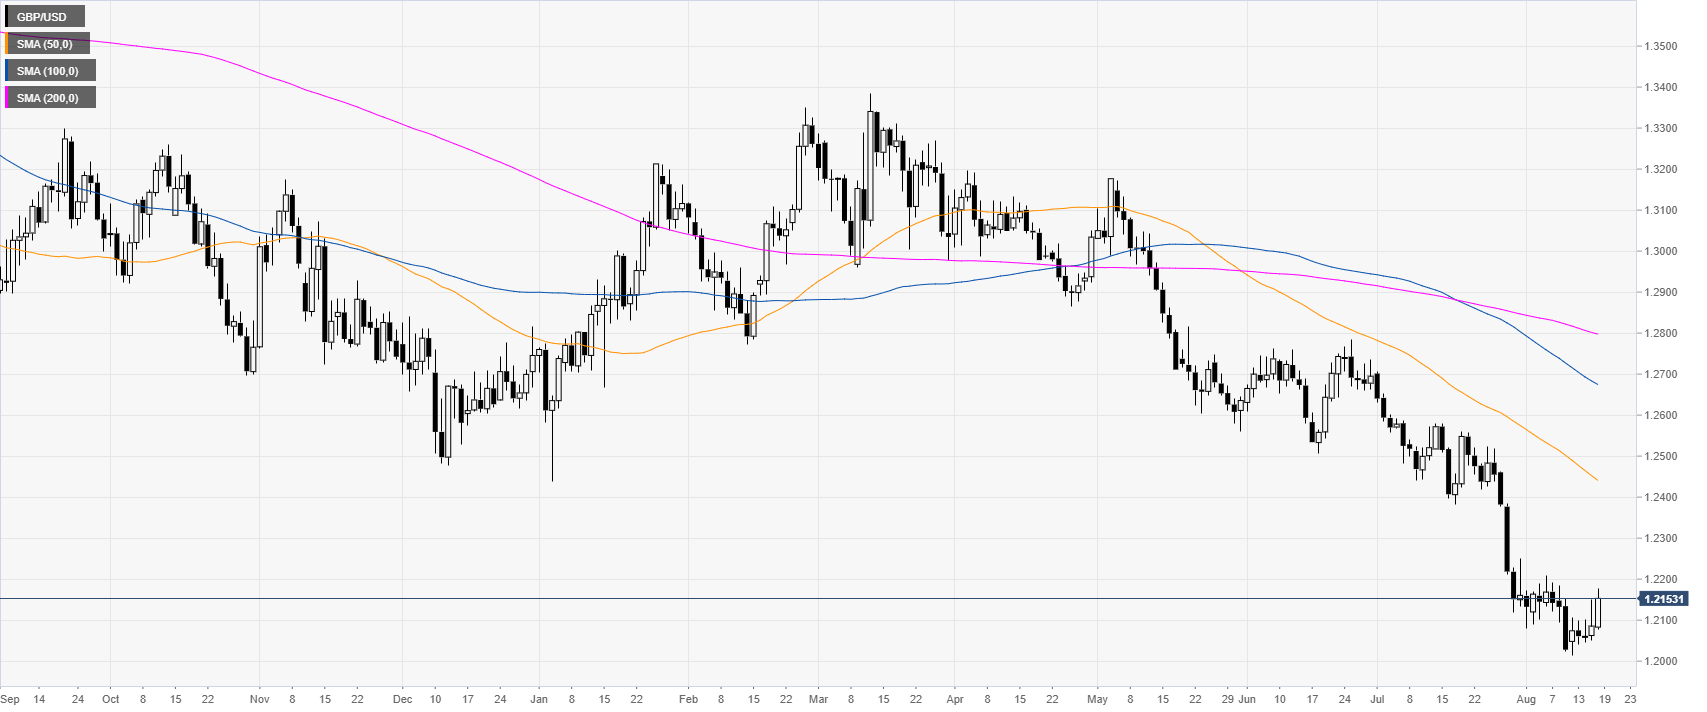
GBP/USD daily chart
The Cable is trading in a bear trend below its main daily simple moving averages (SMAs).
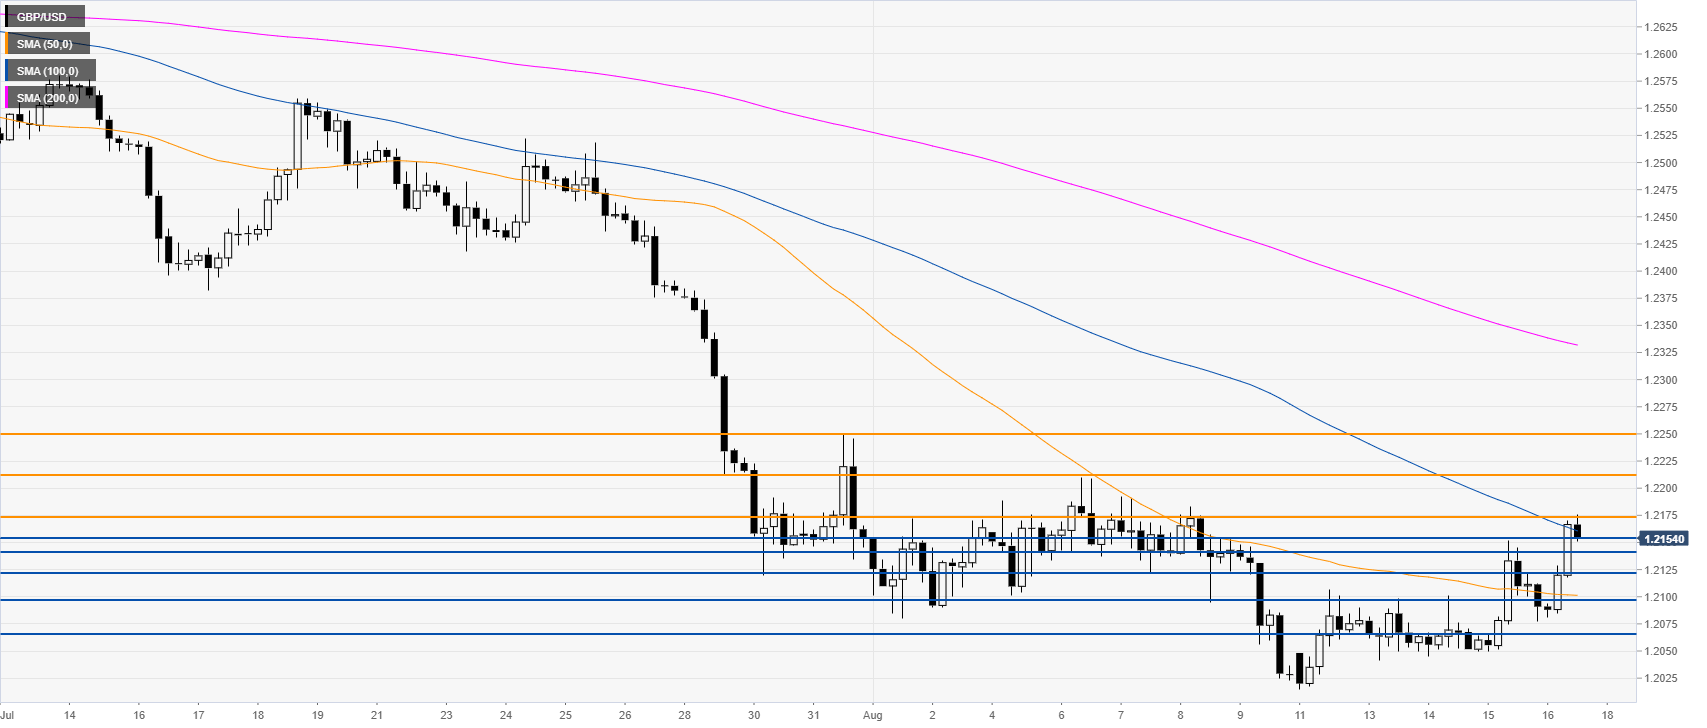
GBP/USD 4-hour chart
The Cable has been challenging the 1.2173 resistance and the 100 SMA. A break above 1.2173 level could lead to 1.2198, 1.2211 and 1.2249, according to the Technical Confluences Indicator.
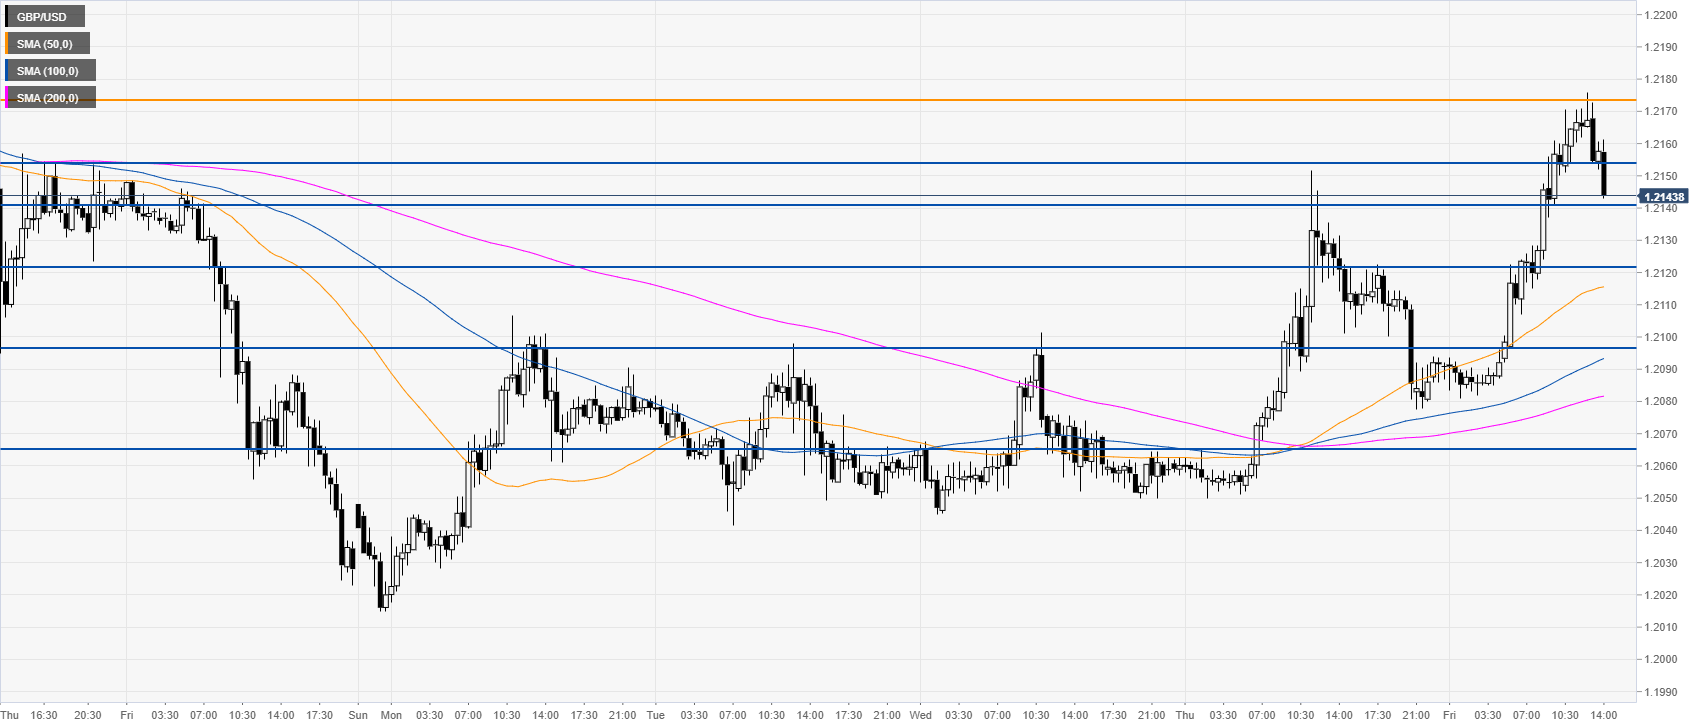
GBP/USD 30-minute chart
In the short term, as the market retraces down below 1.2154, it could find potential support at 1.2141, 1.2122, 1.2097 and 1.2065, according to the Technical Confluences Indicator.
Additional key levels
